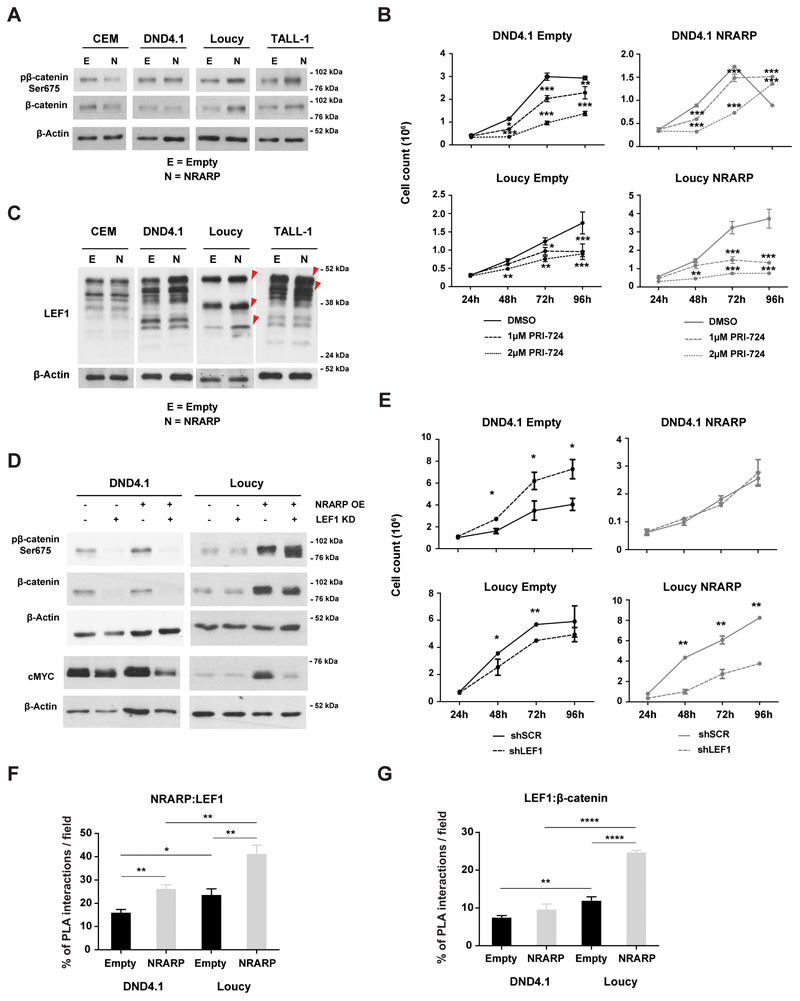
Figure 3. NRARP promotes Wnt signaling in T-ALL cells.
(A) Analysis of WNT signaling activity by measuring β-catenin and pβ-catenin Ser675 protein levels by WB in T-ALL cell lines with and without NRARP overexpression. (B) Effects of Wnt inhibition in the proliferation of T-ALL cells overexpressing or not NRARP using the inhibitor PRI-724. One of three independent assays performed in triplicate is shown. (C) Analysis of LEF1 protein levels in T-ALL cell lines upon NRARP overexpression. LEF1 has several isoforms due to an alternative promoter and alternative splicing. (D) Effects of LEF1 knockdown in β-catenin, pβ-catenin Ser675 and cMYC protein levels in T-ALL cell lines with and without NRARP overexpression. (E) Effects of LEF1 knockdown in the proliferation of T-ALL cells overexpressing or not NRARP. One of three independent assays performed in triplicate is shown. Quantitative analysis of (F) NRARP:LEF1 interactions and (G) LEF1-β-catenin interactions performed by the quantification of cells with and without PLA signals per cell per microscope field. The combination of three independent assays and the analysis of 5 microscope fields per assay is shown. In (B), (E), (F) and (G) data represent the mean ± SEM. Statistical values were obtained using the Student’s t test. *p<0.05, **p<0.01, ***p<0.001, ****p<0.0001.

