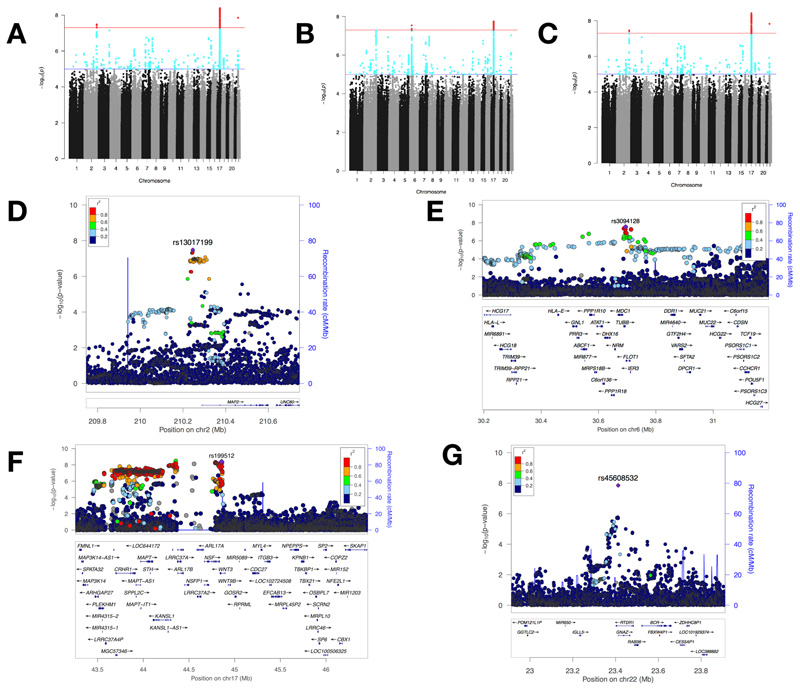
Fig 2. Summary of GWAS of handedness.
(A)-(C) Manhattan plots showing –log10 p-values for SNP associations in GWAS of: (A) right-handers vs left-handers, (B) right-handers vs non-right-handers, and (C) left-handers vs non-left handers. Variants coloured in red have genome-wide significant associations (p=5×10⁻⁸). (D)-(F) Regional association plots of the associated SNPs: (D) rs13017199 at 2q34, (E) rs3094128 at 6p21.33, (F) rs199512 at 17q21.31 (with a wider window to show the entirety of the MAPT region), and (G) rs45608532 at 22q11.22, where the low linkage disequilibrium relationship between the SNPs is consistent with what has previously been reported in this region on chromosome 22 (Dawson et al., 2002). The genomic positions of the SNPs and genes is based on Human Genome build hg19.

