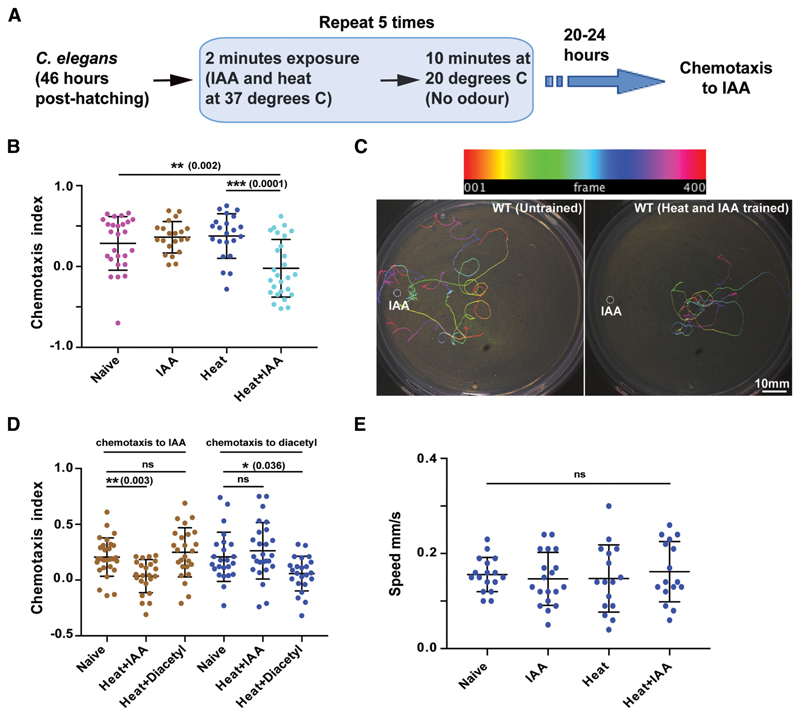
Figure 1. Associative learning in C. elegans.
A, Schematic flowchart of the C. elegans training routine followed in this study. B, Scatter plot showing the effect of IAA and heat on WT C. elegans. C, Representative images of typical chemotaxis tracks. Top, Color-coding of tracks as a function of frame number. D, Scatter plot indicating the specificity of learning. Animals were trained with Heat + IAA or Heat + Diacetyl and their chemotaxis indices were plotted. E, Plot showing speed of worm movement when subjected to different training conditions. Error bars are SD. Multiple comparisons were done using one-way ANOVA and p values were adjusted using Dunnett’s correction method. In graphs of all figures significant p values are added in brackets next to the significance asterisks (*) and “ns” indicates not significant. See Figure 1-1 available at https://doi.org/10.1523/JNEUROSCI.0006-19.2019.f1-1.

