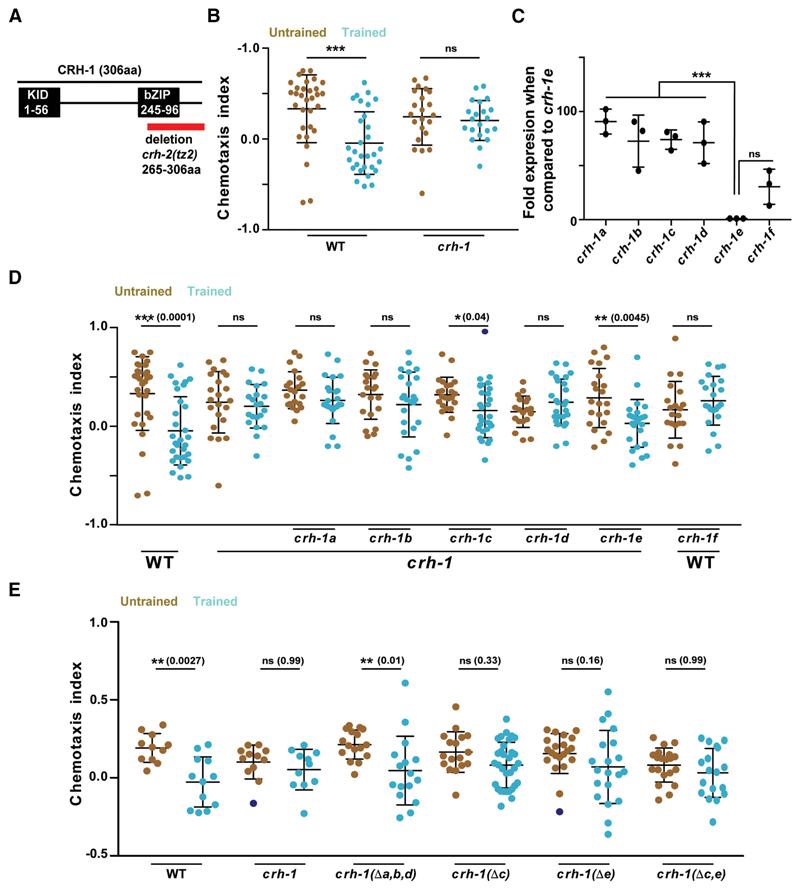
Figure 2. CRH-1c and e are required for associative learning in C. elegans.
A, Schematic showing C. elegans CRH-1 and the deletion in the mutant. Two major functional domains KID and bZIP (DNA-binding domain) domains are depicted. The red bar shows the deletion found in the crh-1-null mutant tz2. This deletion affects all CRH-1 isoforms. B, Scatter plot showing chemotaxis indices of WTand crh-1-null mutants. C, Graph showing quantitative PCR results comparing mRNA expression levels of different CRH-1 isoforms to the CRH-1eisoform in young adult WT C. elegans. D, Scatter plot showing chemotaxis indices of WT, crh-1-null mutants, and pan-neuronal CRH-1 rescue lines using different crh-1 isoforms. E, Scatter plot showing chemotaxis indices of WT, crh-1-null mutants and crh-1 isoform deletion lines. Error bars are SD. Multiple comparisons were done using one-way ANOVA and p values were adjusted using Bonferroni (B, D, E) and Dunnett’s (C) methods. Data points represented with dark blue dots in the scatter plots represents outliers identified using Grubb’s method (α. = 0.05). **p < 0.01, ***p < 0.001, ns, p > 0.05.

