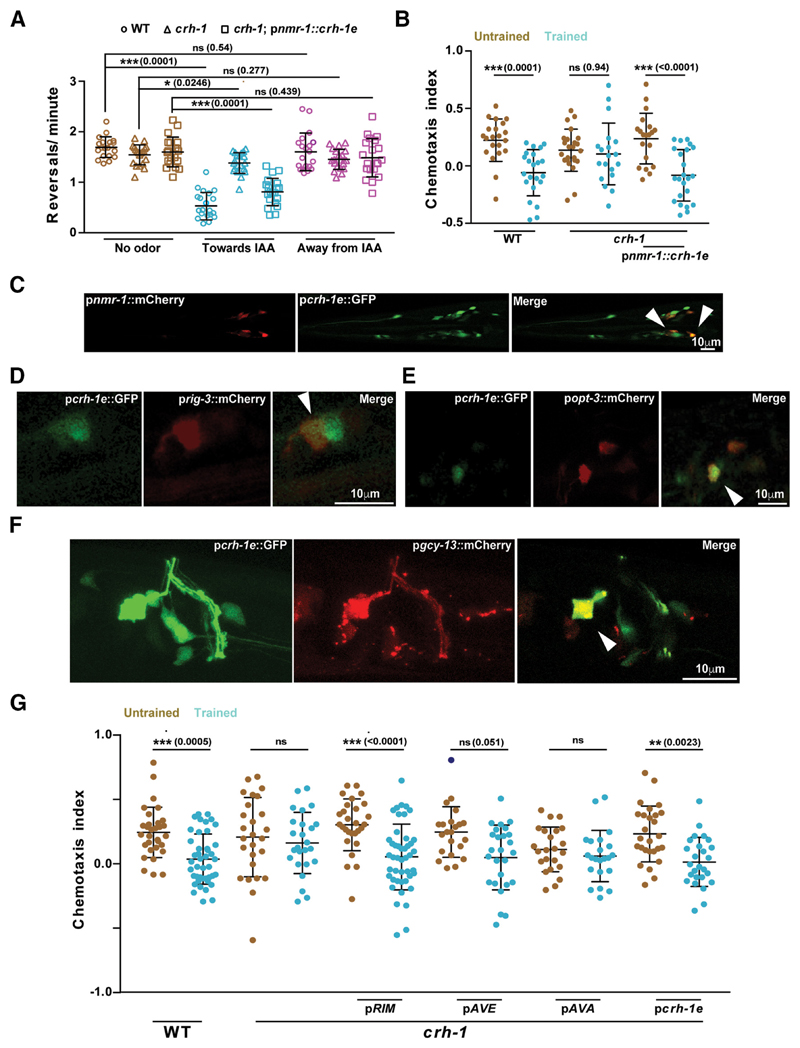
Figure 3. CRH-1e expression in the RIM or AVE interneurons is sufficient to rescue the associative learning phenotype seen in crh-1 mutants.
A, Scatter plot showing reversal frequency of worms while they were moving either in odor free conditions, toward or away from the IAA point source. Each data point represents average reversal events per minute for individual animals counted over 10 min of chemotactic movement. B, Chemotaxis indices for WT, crh-1, and pnmr-1::crh-1e rescue line. C, Confocal microscope images showing overlapping expression of crh-1e promoter with neurons showing expression with the nmr-1 promoter. Arrowheads indicate points of coexpression. D–F, Confocal microscope images showing overlapping expression of crh-1e promoter with neuron-specific promoters; prig-3 (AVA), popt-3 (AVE), and pgcy-13 (RIM). G, Scatter plot showing chemotaxis indices of WT, crh-1, and rescue lines expressing CRH-1e under the promoters; gcy-13 (RIM), opt-3 (AVE), rig-3 (AVA), and crh-1e. Error bars are SD. Multiple comparisons were done using one-way ANOVA and p values were adjusted using Bonferroni method. Data points represented with dark blue dots in the scatter plots represents outliers identified using Grubb’s method (α. = 0.05). *p < 0.05, **p < 0.01, ***p < 0.001, ns, p > 0.05.

