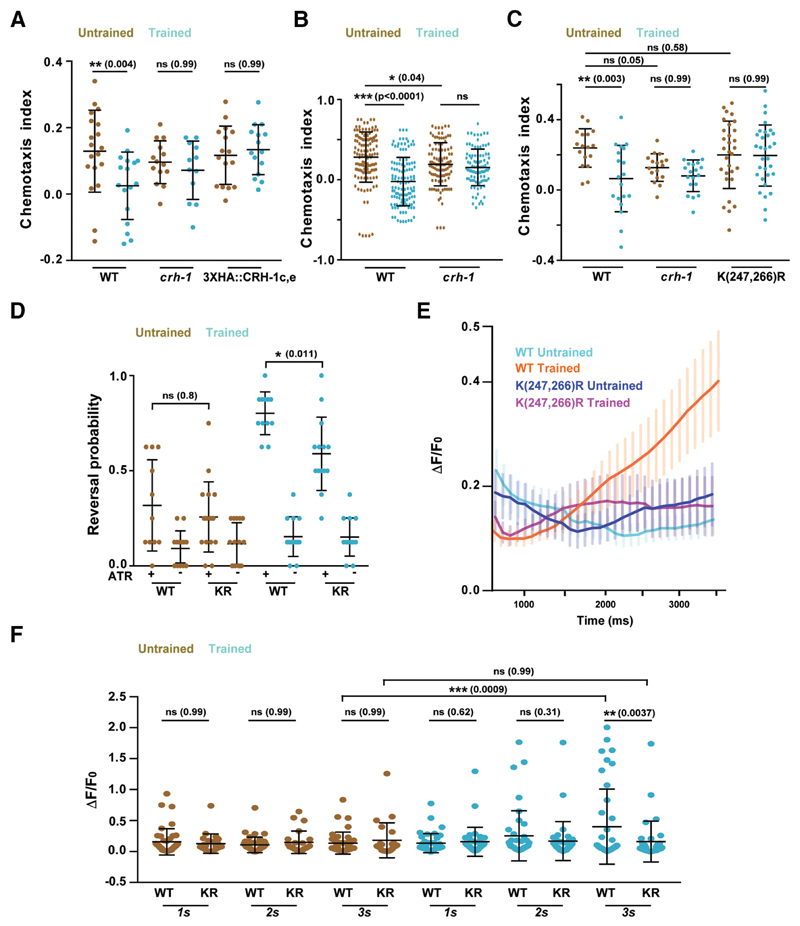
Figure 5. Lysine 247 and 266 residues are required for normal learning but not required for innate chemotaxis in C. elegans.
A, Chemotaxis indices of WT, crh-1-null mutants, and N-terminal 3xHA tagged. CRH-1c and CRH-1e. The tag was appended using CRISPR on N-terminal of CRH1c and CRH-1e translation start codon. B, Scatter plot showing collated chemotaxis index values of WT and crh-1-null C. elegans used in this study. Data were pooled only form the experiments that used both strains. C, Chemotaxis indices of WT, crh1-null mutants, and crh-1(K247R/K266R) mutants. D, Reversal probability of C. elegans when AWC is excited with blue light. Blue light was illuminated for 3 s and reversal events were quantified. If the worm executed reverse movement for one body length, it was counted as a reversal event. Each C. elegans was illuminated with blue light 8 times with 20 s (s) intervals between subsequent stimulations. Each dot in the scatter plot indicates the reversal probability of a single animal under observation. E, Plot showing Calcium traces of the AVA neuron in responseto ChR2-mediated AWC activation. Mean values are plotted against time. Error bars are SEM. n = 25–41 for each genotype. F, Scatter plot comparing AVA excitation in response to AWC activation at three time points. The figure represents a subset of data (1, 2, 3 s) from E. Error bars are SD except in E (SEM). Multiple comparisons were done using one-way ANOVA and p values were adjusted using Bonferroni (A, D, F) and Dunnett’s (B, C) method. *p < 0.05, **p < 0.01, ***p < 0.001, ns, p > 0.05.

