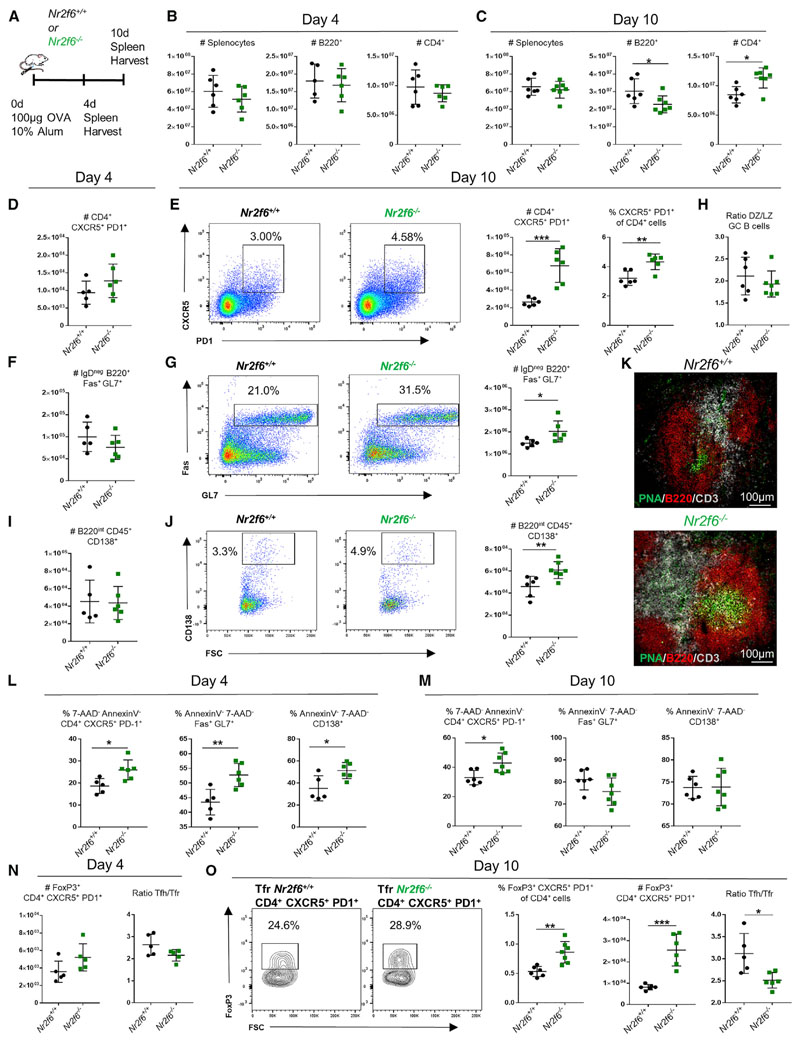
Figure 1. Nr2f6 Loss Leads to Tfh Cell Accumulation and Increased GC Responses following OVA-Alum Immunization.
(A) Experimental setup used for OVA-alum immunization of Nr2f6+/+ or Nr2f6−/− mice.
(B and C) Total counts of Nr2f6+/+ or Nr2f6−/− splenocytes, B220+ cells, and CD4+ cells on (B) day 4 or (C) day 10 after immunization.
(D and E) Splenic Tfh cell numbers on (D) day 4 or (E) day 10 after immunization; representative flow cytometry plots for Nr2f6+/+ and Nr2f6−/− Tfh cells, total Tfh cell counts, and Tfh cell frequency within CD4 cells. Total Tfh cell counts are shown as total live non-Tfr cells (annexin V−, FoxP3−, and 7-AAD−).
(F) Total germinal center B cell counts on day 4.
(G) Day 10 representative flow cytometry plots, with total cell counts.
(H) GC LZ and DZ distribution in Nr2f6+/+ or Nr2f6−/− GCs 10 days after immunization.
(I and J) PC counts on day 4 (I), and representative flow cytometry plots and cell counts on day 10 (J).
(K) Immunofluorescence staining for CD3 (white), B220 (red), and peanut agglutinin (PNA) (green) on 5 μM sections of spleens harvested day 10 after OVA immunization.
(L and M) Frequency of live Tfh cells, GC B cells, and PCs (annexin V− 7-AAD−) on (L) day 4 or (M) day 10 after OVA-alum immunization.
(N) Tfr (CD4+, CXCR5+, PD-1+, and FoxP3+) total cell counts on day 4 (left panel), and the Tfh cell to Tfr cell ratio (right panel).
(O) Representative FoxP3 staining of Nr2f6+/+ or Nr2f6−/− CD4+ CXCR5+ PD-1+ T cells, total Tfr cell counts, total Tfr frequency of all CD4 cells, and the Tfh cell to Tfr cell ratio on day 10 post-immunization.
Data shown are from at least two separate experiments with n ≥ 5. The middle bar represents the average for the dataset. Error bars represent SD, and an asterisk indicates statistically significant differences calculated using two-tailed Student’s t test or Mann-Whitney U test. A p value of <0.05 was considered statistically significant. *p < 0.05; **p < 0.01; ***p < 0.001.

