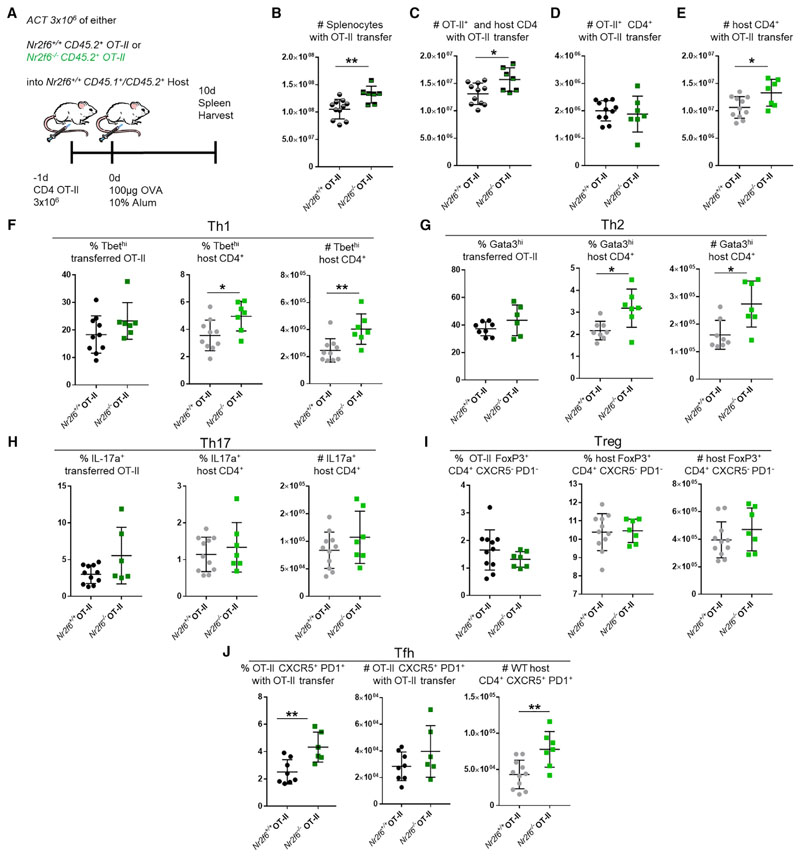
Figure 4. Adoptive Cell Transfer of Nr2f6-Deficient OT-II T Cells into Wild-Type Hosts Results in Increased Host CD4 Tfh, Th1, and Th2 Subsets.
(A) Experimental scheme showing adoptive transfer of 3 × 10⁶ OT-II CD4+CD45.2+ Nr2f6+/+ (black) or Nr2f6−/− (green) into Nr2f6+/+ CD45.1/CD45.2 congenic mice with OVA-alum immunization (n ≥ 7 per group).
(B) Total splenocytes, with Nr2f6+/+ or Nr2f6−/− OT-II adoptive cell transfer.
(C) Total CD4 T cell counts, including both host and transferred OT-II cells.
(D and E) Transferred OT-II T cell counts (D) and total host CD4 T cell counts (E).
(F) Frequency of Th1 cells from the indicated OT-II populations or host cells (left and middle panels). Total host Th1 cells in the spleen with indicated OT-II T cell transfer (right panel).
(G) Th2 as a frequency of OT-II or host CD4 T cell populations and total Th2 cells from the host CD4 T cells.
(H) Frequency and total cell count of Th17 cells.
(I) Treg subset defined as CXCR5− PD-1− CD4+ FoxP3+ from both OT-II transferred cells and host cells.
(J) Tfh cells defined as CXCR5+ PD-1+ Foxp3− CD4+ from OT-II and host cells.
Results shown are derived from three independent experiments (n ≥ 7). The middle bar shows an average of each dataset. Error bars represent SD, and an asterisk indicates statistically significant differences between genotypes calculated using Student’s t test or Mann-Whitney U test. A p value of <0.05 was considered statistically significant. *p < 0.05; **p < 0.01.

