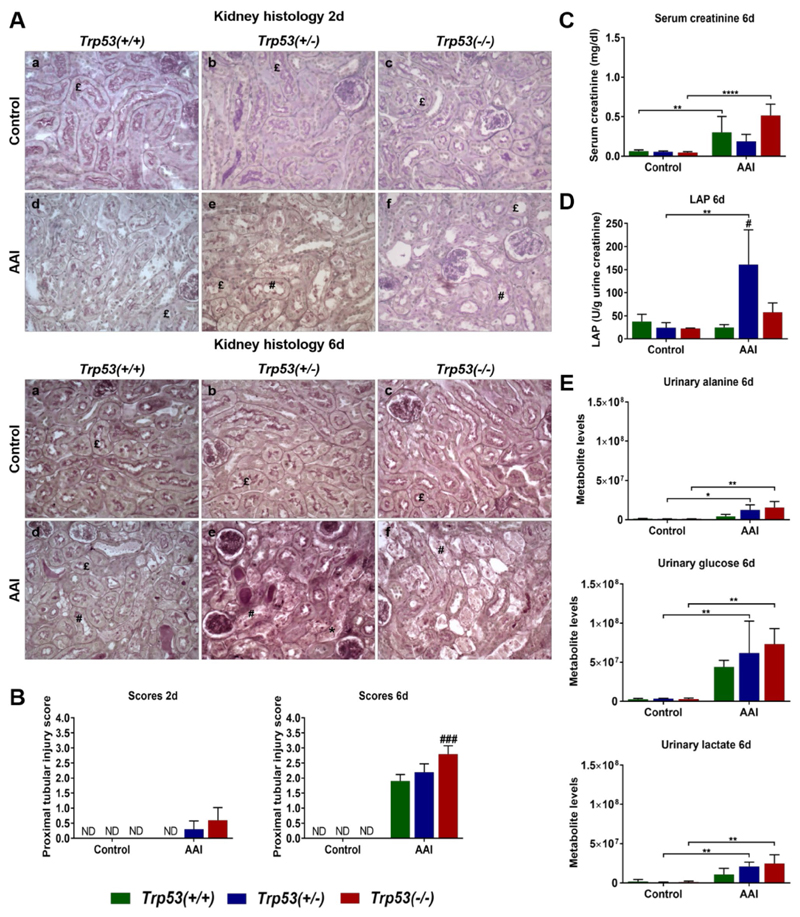
Fig. 2.
a Histopathology of mouse kidneys exposed to AAI for 2 (upper panel) and 6 (lower panel) days. Representative photomicrographs of renal longitudinal sections stained with PAS at a magnification of 400×. Normal proximal tubules (£), injured proximal tubules (#) and necrosis (*) are indicated. b Semi-quantitative proximal tubular injury score at 2 (left panel) and 6 (right panel) days. Scores were determined on PAS-stained kidney sections (n = 5 mice/group). ND not detected. c Serum creatinine levels in AAI-treated mice (6 days). Serum creatinine (mg/dl) levels were determined by HPLC analysis (n = 5 mice/group). d LAP enzyme activity in AAI-treated mice (6 days). LAP activity (U/g urine creatinine) was determined using a spectrofluorometric assay (n = 3 mice/group). e Urinary metabolite levels in AAI-treated mice (6 days). Alanine (upper panel), glucose (middle panel) and lactate (lower panel) levels (arbitrary units) in urine were measured by NMR (n = 3 mice/group). Results are presented as mean ± SD. Statistical analysis was performed by twoway ANOVA and Bonferroni’s post hoc test (*p ≤ 0.05, **p ≤ 0.01, ****p ≤ 0.0001, comparison as indicated); and by one-way ANOVA and Tukey’s post hoc test [#p ≤ 0.05, ###p ≤ 0.001, in comparison to Trp53(+/+) within that treatment group]

