Fig. 4.
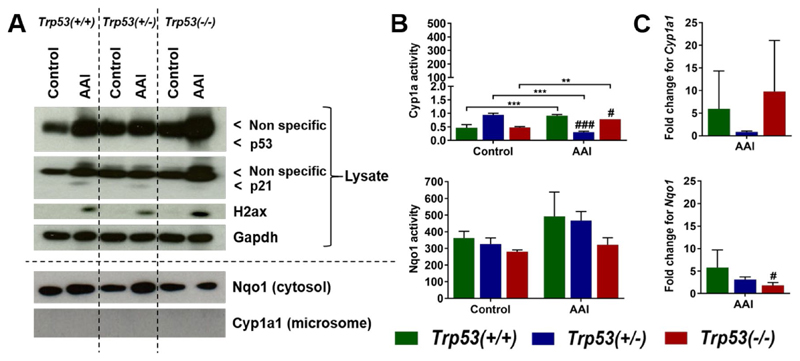
a Protein expression in AAI-exposed mouse kidneys. Western blot analysis of p53, p21 and H2ax expression in kidney tissue from AAI-treated (6 days) Trp53(+/+), Trp53(+/−) and Trp53(−/−) mice. Nqo1 and Cyp1a1 expression was investigated in AAI-exposed (6 days) kidney cytosols and microsomes, respectively. Gapdh expression was used as a loading control. Representative images of Western blots are shown; at least duplicate analyses from independent experiments were performed. b Enzyme activity in AAI-exposed mouse kidneys. Cyp1a activity at 6 days (upper panel) was determined by the EROD assay. Results are presented as mean ± SD derived from independent in vitro measurements (n = 3/group). Nqo1 activity at 6 days (lower panel) was determined by the NQO1 assay. Results are presented as mean ± SD derived from independent in vitro measurements (n = 3/group). c Gene expression in AAI-exposed mouse kidneys. The fold change for Cyp1a1 (upper panel) and Nqo1 (lower panel) is the fold change in expression relative to the control for each genotype. Gene expression was determined by qRT-PCR and the 2−ΔΔCt method (n = 5 mice/group). Statistical analysis was performed by two-way ANOVA and Bonferroni’s post hoc test (**p ≤ 0.01, ***p ≤ 0.001, ****p ≤ 0.0001, comparison as indicated); and by one-way ANOVA and Tukey’s post hoc test (#p ≤ 0.05, ##p ≤ 0.01, ###p ≤ 0.001, ####p ≤ 0.0001, in comparison to Trp53(+/+) within that treatment group)

