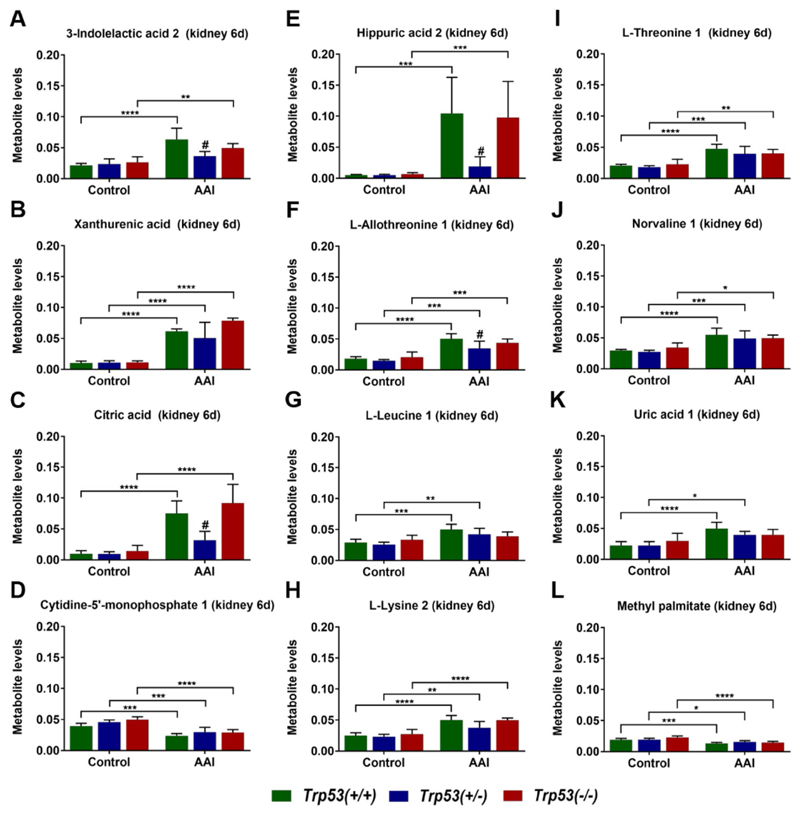
Fig. 5.
Metabolite levels in kidney tissues of AAI-treated mice (6 days). a 3-indolelactic acid 2, b xanthurenic acid, c citric acid, d cytidine-5′-monophosphate 1, e hippuric acid 2, f l-allothreonine 1, g l-leucine 1, h l-lysine 2, i l-threonine 1, j norvaline 1, k uric acid 1 and (l) methyl palmitate levels (arbitrary units) in kidney tissues were measured by GC–MS. Results are presented as mean± SD (n = 5 mice/group). Statistical analysis was performed by two-way ANOVA and Bonferroni’s post hoc test (*p ≤ 0.05, **p ≤ 0.01, ***p ≤ 0.001, ****p ≤ 0.0001, comparison as indicated); and by one-way ANOVA and Tukey’s post hoc test (#p ≤ 0.05, in comparison to Trp53(+/+) within that treatment group)

