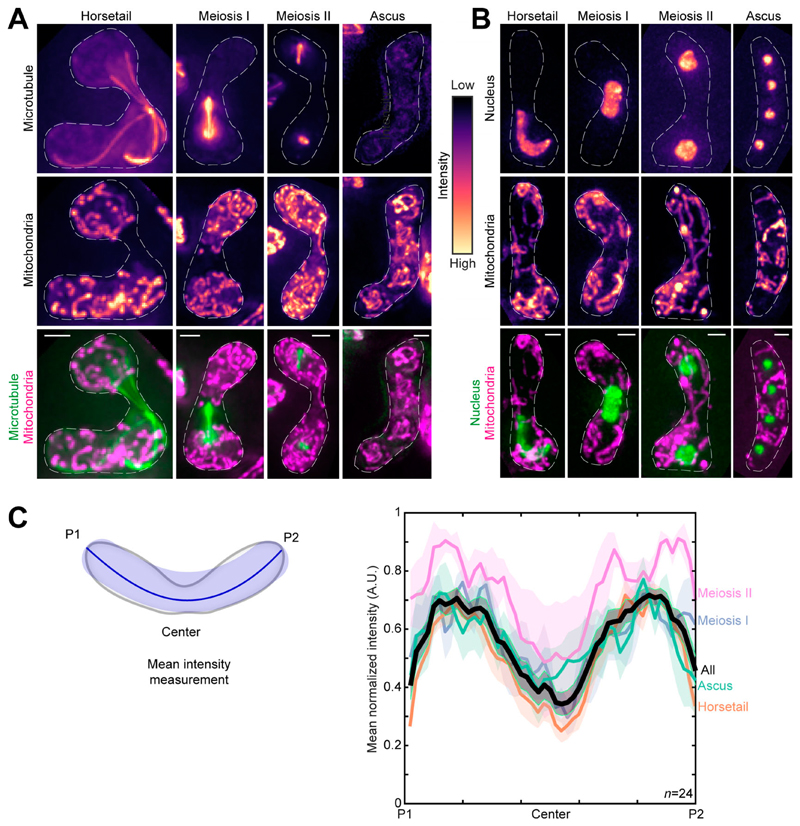
Figure 1. Mitochondria remain close to the cell poles during meiosis.
(A) Maximum-intensity–projected images of microtubules (top) and mitochondria (middle) represented in the intensity map to the right of the images, and their merge (bottom) during the different stages of meiosis indicated (strain KI001xPT1651; see Table S1). (B) Maximum-intensity–projected images of the nucleus (top) and mitochondria (middle) represented in the intensity map to the left of the images, and their merge (bottom) during the different stages of meiosis indicated (strain FY15112; see Table S1). In A and B, scale bars represent 2 µm and dashed lines represent cell outlines. (C) Schematic (left) of the mean intensity measurement along the length of a zygote from pole P1, through the center, to pole P2. Plot of mean normalized intensities (right) from different stages of meiosis (colored lines) and their combined mean intensities (black line, n = 24) obtained from the data in A. The shaded regions represent the SEM.

