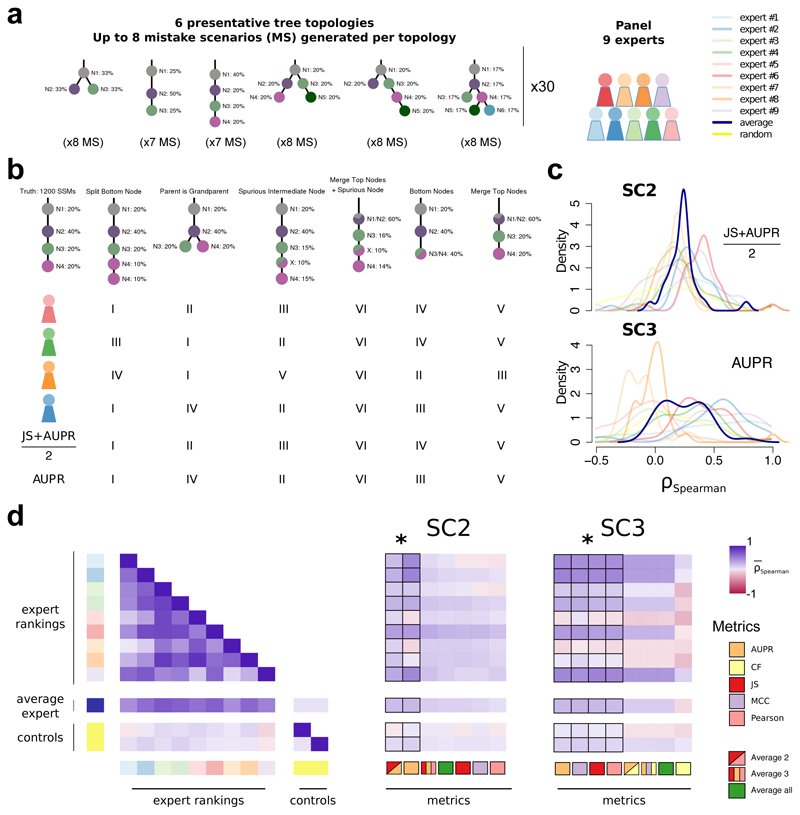
Figure 2. Quantifying performance of subclonal reconstruction algorithms.
(a) Tree topologies and mistake scenarios. For each of 30 tree topologies with varying number of clusters and ancestral relationships, 7-8 mistake scenarios (MS) were derived and scored using the identified metrics for SC2 and SC3. For each tree topology a panel of 9 experts independently ranked the mistake scenarios from best to worse. (b) Expert ranking. One tree topology is shown with 6 of the 7 mistake scenarios together with the ranks of four experts and two of the metrics. The trivial all-in-one case, i.e. identifying only one cluster is not shown and correctly ranked last by all metrics and experts. (c) Density distributions of Spearman’s correlations between metrics and experts across tree topologies. For SC2 and SC3, we show the Spearman’s correlations between JS+AUPR/2 and the experts, and AUPR and the experts, respectively. (d) All average correlations between experts and metrics for SC2 and SC3. Heatmaps of average Spearman’s correlations across tree topologies between experts and metrics for SC2 and SC3. Controls are randomised ranks.
Asterisks show equivalent metrics (non-significantly better or worse according to a Wilcoxon rank-sum test p>0.05 but better than the others p<0.01; n=270; range of median increase in correlation coefficients: SC2=[0.018-0.23]; SC3=[0.024-0.36]).

