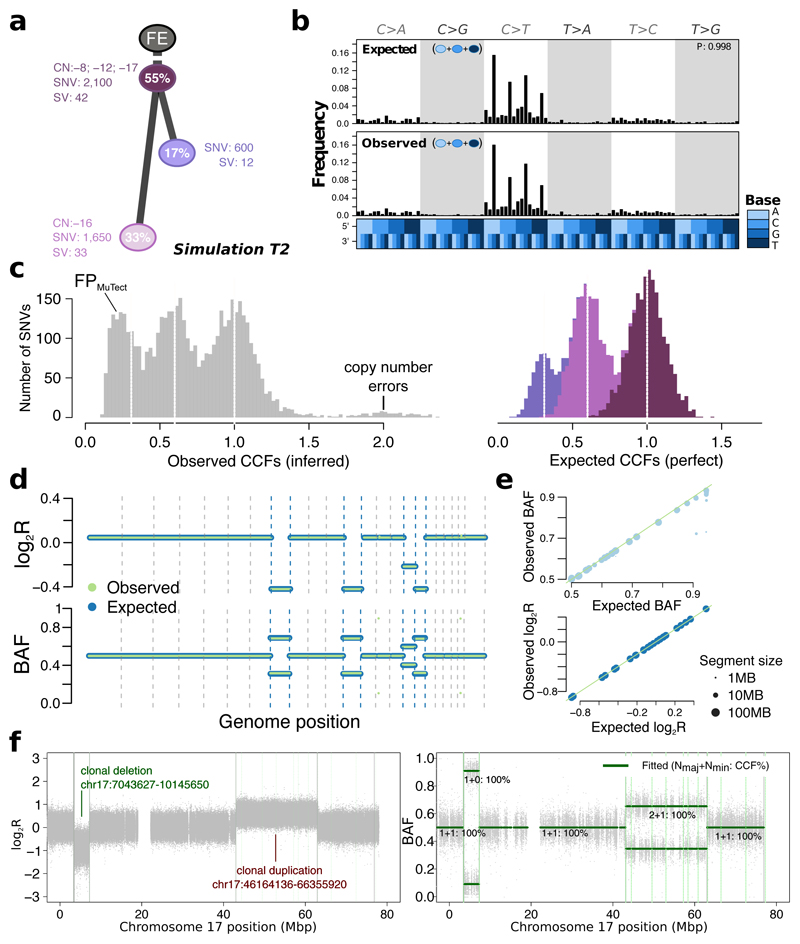
Figure 4. Simulated realistic tumor genomes.
(a) Tumor design. Simulation T2 with 55% purity (fraction of cancer cells) and two subclones. Whole-chromosome copy number events (e.g. clonal loss of chromosomes 8, 12 and 17), number of SNVs and SVs are shown for each node. (b) Single nucleotide variant trinucleotide contexts. Observed vs. expected frequencies of trinucleotide contexts in the SNVs. (c) Population frequency (cancer cell fraction, CCF) of the variants for T2. Observed vs. expected CCF distributions; false positive SNVs due to mutation calling as well as copy-number errors lead to errors in the inferred CCFs. (d) Observed (green) vs. expected (blue) logged coverage ratio (LogR) and B-allele frequencies (BAF) of copy number segments along the genome for T2 (e) Observed vs. expected BAF and logR across all segments and across all simulations. (f) Simulation of sub-chromosomal copy number events and rearrangements. LogR and BAF tracks showing how one large deletion and one large duplication simulated on chromosome 17 are correctly being called. Structural variants as called by Manta (Online methods) are shown as vertical lines, true positives are at the breakpoints defining the copy number events.

