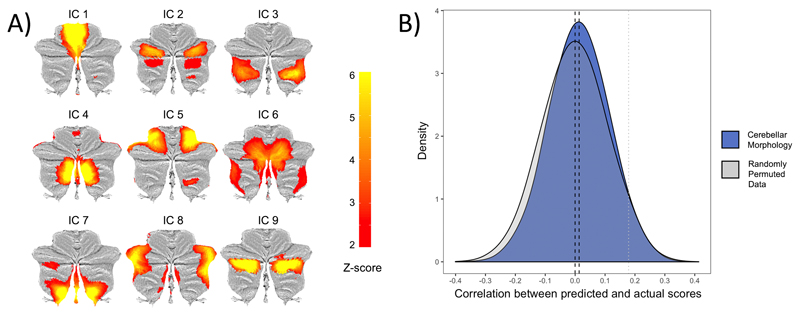
Figure 2. Replication analyses in the Dunedin Study of the original ICA-derived cerebellar morphology associations with p factor scores from Moberget et al. (19).
A) The nine independent components resulting from data-driven decomposition of cerebellar grey matter maps projected onto flat-maps of the cerebellar cortex (36). B) Distributions of correlations between predicted and actual p factor scores across 10,000 iterations of the 10-fold cross-validated model using the average of the 9 independent components from A compared to the empirical null-distribution. The black dotted lines represent the mean for each distribution and the grey dotted line represents the one-tailed .05 threshold. The nine ICA-derived components predicted p factor scores beyond chance on average, but the difference from the empirical null distribution was p = 0.53, suggesting non-significant replication of Moberget et al. (19).

