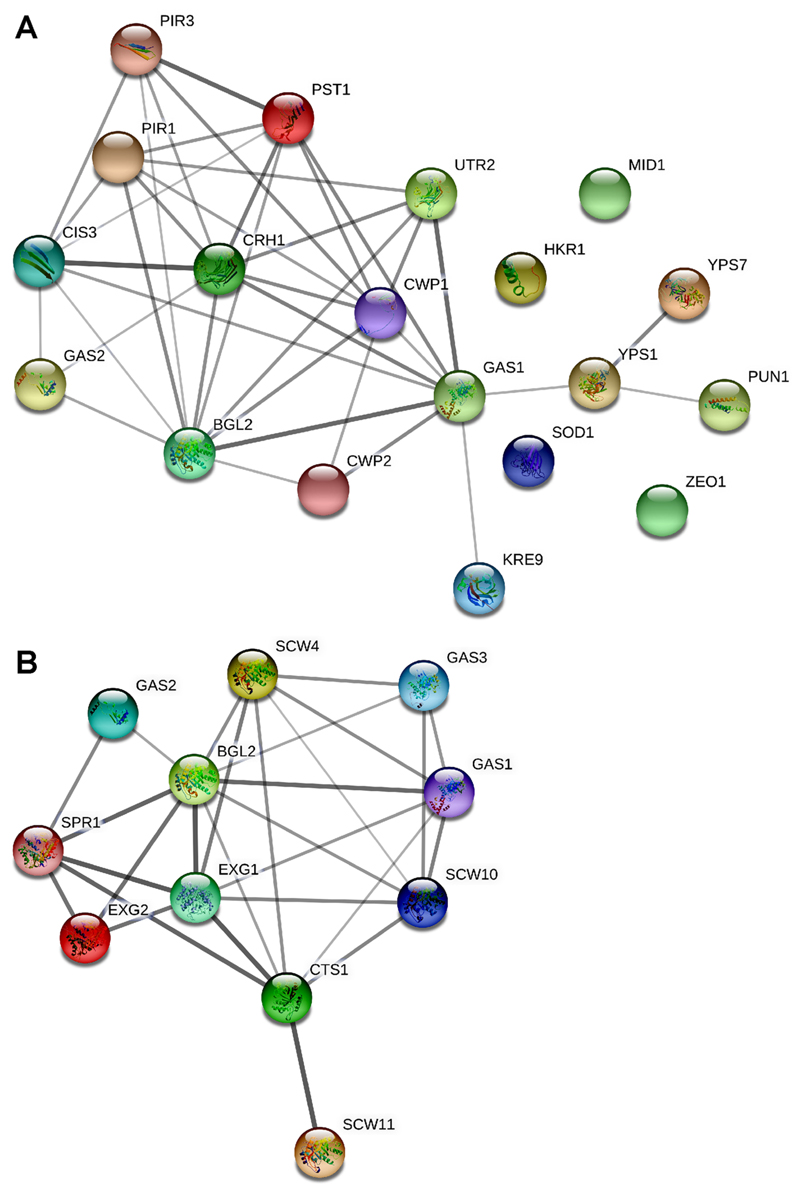
Figure 3.
Protein–protein interaction network analysis. Networks, constructed by the STRING Protein–Protein Interaction Network (Ver 11.0) tool, depict interactions, among proteins identified in the wild-type secretome, that belonged to fungal-type cell wall organization (A) and carbohydrate metabolic process (B) categories. Since majority of C. glabrata proteins are uncharacterized, networks were constructed using the S. cerevisiae orthologs of identified C. glabrata proteins and S. cerevisiae as the reference strain. The line thickness reflects strength of the interaction.

