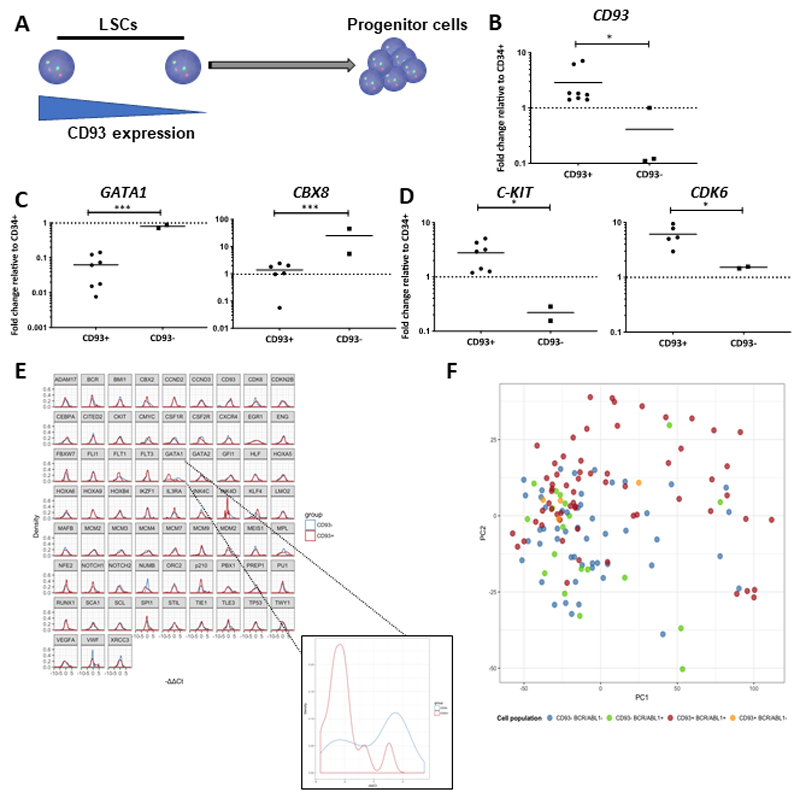
Figure 4. Gene expression profiling of bulk CD93-selected CP-CML LSCs confirms their quiescent character.
(A) Schematic diagram of CD93 expression within a stem cell population. (B) CD93 gene expression as determined in the lin-CD34+CD38-CD90+CD93+ and lin-CD34+CD38-CD90+CD93- population (p=0.0068). Results are presented as fold change compared to the CD34+ bulk population using the ΔΔCt method. (C) Key genes involved in lineage restriction were overexpressed in the lin-CD34+CD38-CD90+CD93- population, namely GATA1 and CBX8. (D) Key genes involved in stem cell maintenance were upregulated in the lin-CD34+CD38-CD90+CD93+ population. (E) Normalized differential gene expression of the single cells using the ΔΔCt method. The control sample is the mean of the CD93- on each chip. GATA1 was significantly downregulated in the CD93+ population (n=2 CP-CML samples, q=0.03). (F) Principal component analysis (PCA) of the 4 different populations defined by CD93 surface presence and BCR-ABL1 expression. Each individual dot represents a single cell. It can be observed that the CD93+ BCR-ABL1+ cells (in red) are more heterogeneous than the other populations and that they form a slightly different cluster.

