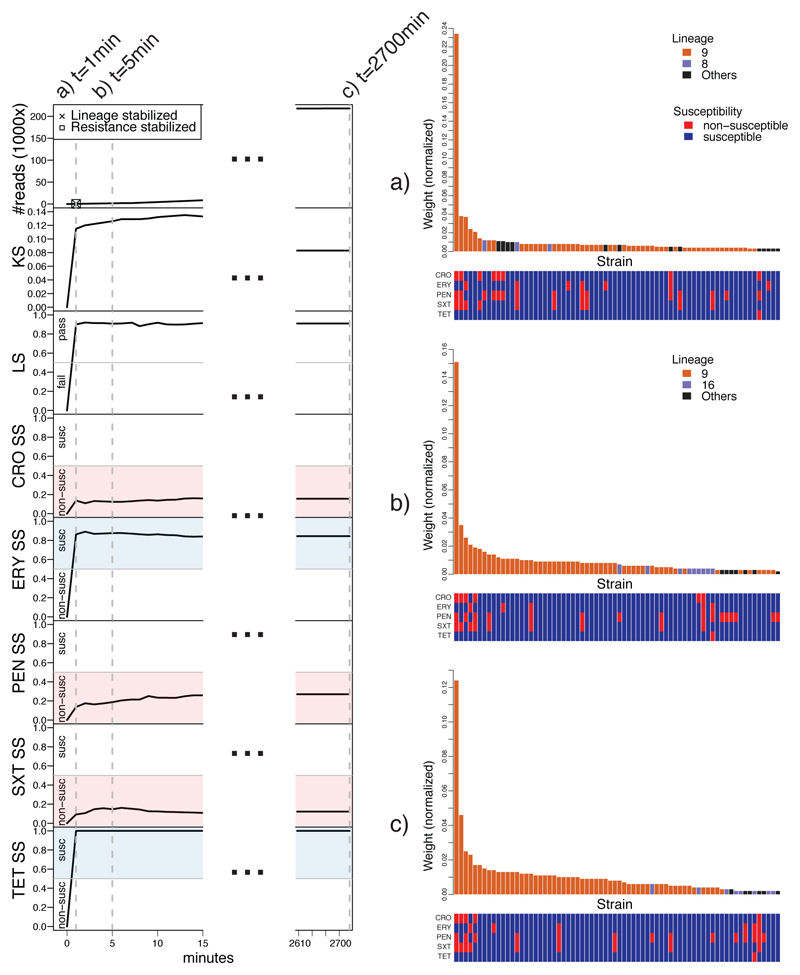
Fig. 2. RASE obtains stable predictions of antibiotic resistance or susceptibility and lineage within minutes for an isolate of a pneumococcal 23F clone (SP06).
Left: Number of reads, lineage score (LS), k-mer score (KS), and susceptibility scores (SS) for individual antibiotics as a function of time from the start of sequencing. In the top left plot, the times of stabilization are shown for the predicted lineage and susceptibility or resistance to all antibiotics. Blue and red colors correspond to susceptibility and non-susceptibility calls, respectively. The dashed lines mark selected time points (1 minute, 5 minutes, and the end of sequencing). Right: a)-c) Similarity rank plots for selected time points (1 minute, 5 minutes, and the end of sequencing). The bars correspond to 70 best matching strains in the database and display the normalized weights, which serve as a proxy to inverted genetic distance. They are arranged by rank and colored according to the presence in the predicted, alternative or another lineage. The bottom panels display the resistance profiles of the strains.

