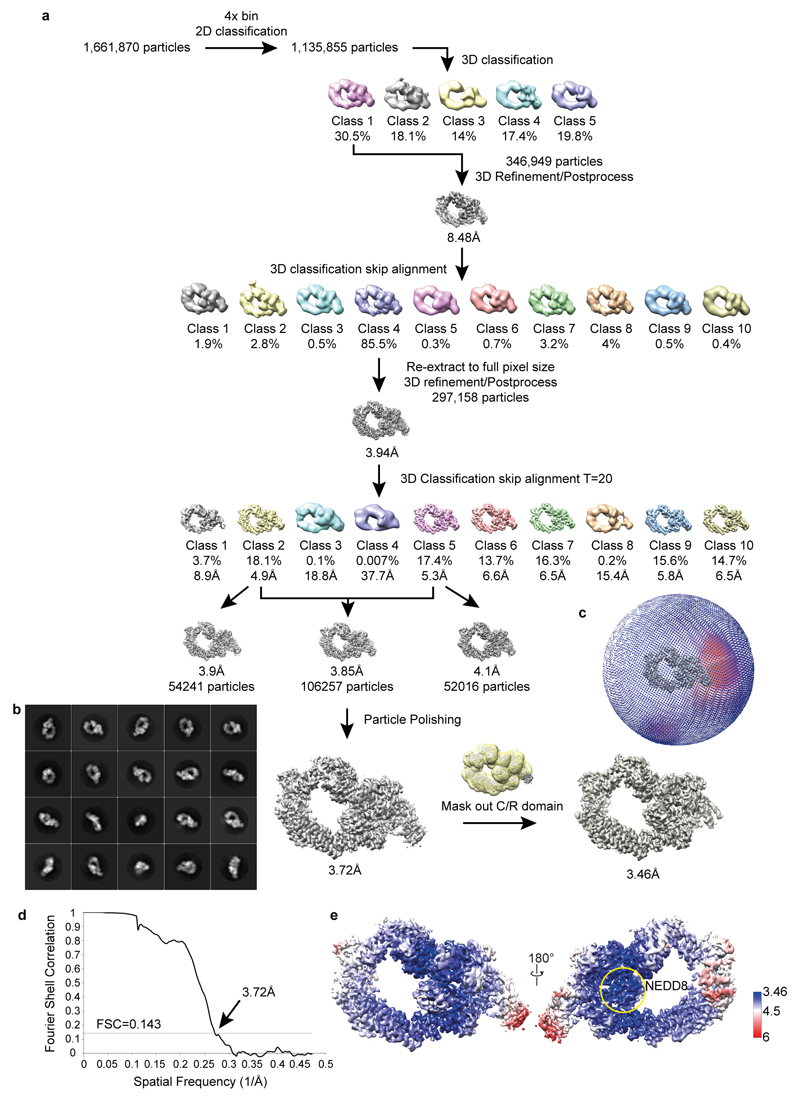
Extended Data Figure 4. Cryo-EM image processing flow chart.
a, Cryo-EM image processing work chart. Ultimately, reconstruction of the data yielded a focused refinement at 3.46 Å resolution and a global refinement at 3.7 Å resolution that superimposes well with lower resolution maps obtained during attempts to visualize substrate priming with neddylated wild-type dimeric CRL1β-TRCP. b, 2D classes representing particles used for final reconstructions. c, Angular distribution of final reconstruction. d, Gold standard Fourier Shell Correlation curve showing overall resolution at 3.72Å at FSC=0.143. e, EM density map colored by local resolution. NEDD8, encircled in yellow, is the entity displaying the highest local resolution in the map.

