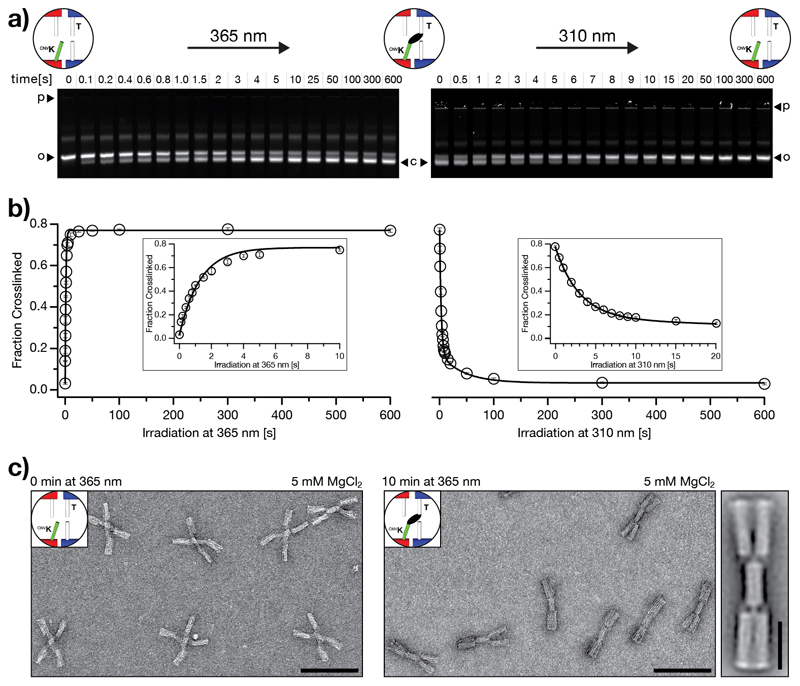
Figure 2.
Kinetic characterization of photo-crosslinking and photo-splitting using the DNA origami switch object. a) Fluorescent images of 1.5% agarose gels laser-scanned in the Cy5-channel (635 nm). Time series of photo-crosslinking at 365 nm irradiation (left) and photo-splitting at 310 nm irradiation (right). p: pocket, o: band corresponding to open (non-crosslinked) switch particles, c: band corresponding to closed (crosslinked) switch particles. The images of the gels are globally autoleveled. b) Evaluation of the gel data shown in a). We performed the experiment in triplicate (Figure S2); data points represent the mean and error bars the standard deviation. The fraction of crosslinked particles is computed as described in the methods section (4. UV-irradiation). We fitted the photo-crosslinking data by using a single exponential with rate constant kc and the photo-splitting data by using a double exponential with rate constants ks1 and ks2 (solid lines). We obtained for the rate constants of photo-crosslinking and -splitting kc = 0.7 s-1, ks1 = 0.02 s-1, and ks2 = 0.3 s-1, respectively. c) Negative-stain TEM data of non-irradiated (non-crosslinked) switch particles (left) and irradiated (crosslinked) switch particles (right). Scale bars: 100 nm. See Figure S6 for field-of-views. Average 2D-particle micrograph of the cnvK-crosslinked switch object (rightmost). Scale bar: 25 nm.

