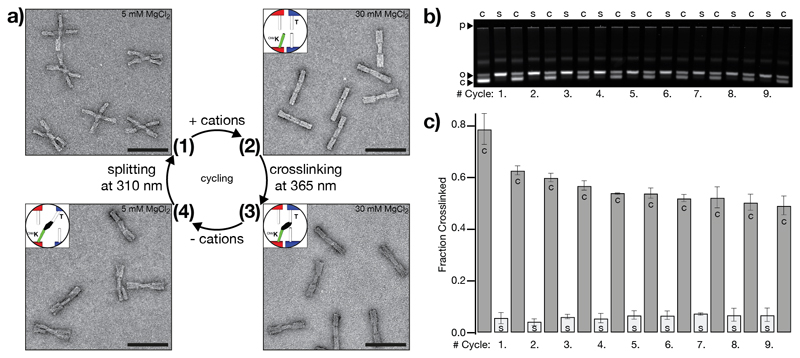
Figure 3.
Reversibility and cycling. a) Negative-stain TEM data of one cycle of photo-crosslinking and photo-splitting that is illustrated in Figure1. Scale bars: 100 nm. See Figure S7 for field-of-views. b) Fluorescent image of a 1.5% agarose gel laser-scanned in the Cy5-channel (635 nm). Samples of nine successive cycles of photo-crosslinking and photo-splitting are loaded on the gel. c: crosslinking with 365 nm light for 5 minutes, s: splitting with 310 nm light for 5 minutes (top labels). p: pocket, o: band corresponding to open (non-crosslinked) switch particles, c: band corresponding to closed (crosslinked) switch particles (left labels). The image of the gel is globally autoleveled. c) Evaluation of the gel data shown in b). We performed the experiment in duplicate (Figure S8); data points represent the mean and error bars the standard deviation. The fraction of crosslinked particles is computed as described in the methods section (4. UV-irradiation). c: crosslinking at 365 nm, s: splitting at 310 nm.

