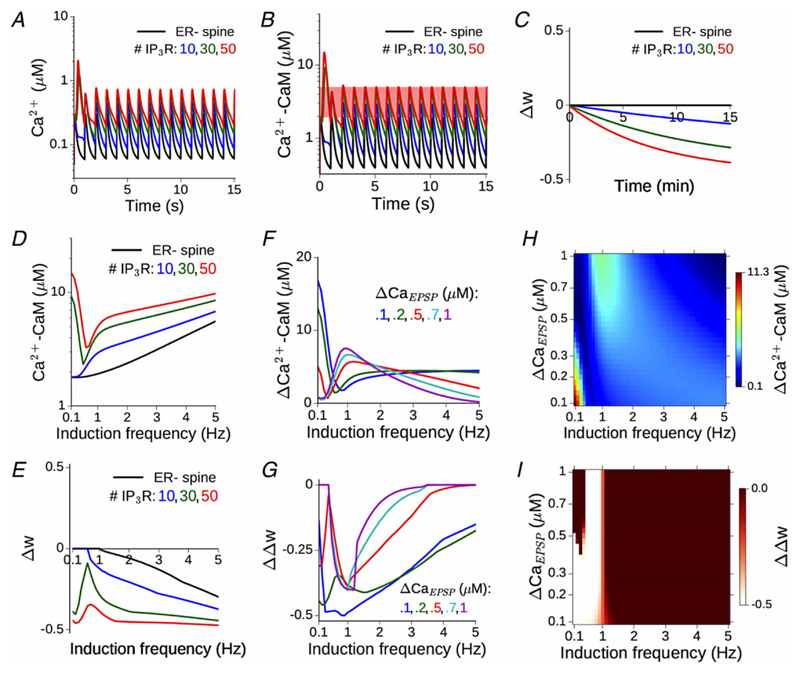
Figure 4. Ca2+ release from ER robustly enhances the spine Ca2+ signal and facilitates LTD induction at low input rates.
A, time course of Ca2+ evoked by repeated synaptic input at 1 Hz in the model ER− spine (black) and an equivalent ER+ spine with 10–50 IP3 receptors. ΔCaEPSP = 0.2 μM in the ER− spine. B, the corresponding time dependence of Ca2+-bound calmodulin (CaM) in the ER−/ER+ spine head. Total CaM concentration = 50 μM. C, change in the synaptic weight variable, w, driven by the activated CaM during a 1 Hz input train applied for 15 min (900 spikes). For this specific instantiation of the model, the plasticity threshold θD has been set to 2 μM, such that no LTD is induced in the absence of ER contribution, and LTD induction is facilitated with increasing flux through IP3Rs. D, the amplitude of CaM response to synaptic inputs in the 0.1–5 Hz range is compared between the ER− spine (black) and equivalent ER+ spine with 10–50 IP3 receptors (coloured curves). E, change in the weight variable w at the end of 900 spikes in the ER− (black) and ER+ spines (coloured curves), corresponding to D. θD is set to give no LTD in the ER− spine for frequencies ≲ 1 Hz. F, the differential CaM response profile in an ER+ spine with 30 IP3Rs relative to the ER− spine for different choices of ΔCaEPSP (i.e. NMDAR conductance). G, differential LTD induction, ΔΔw, in an ER+ spine with 30 IP3Rs relative to an ER− spine for different choices of ΔCaEPSP. H, change in maximum CaM activation due to the presence of ER (30 IP3Rs) as a function of the NMDAR conductance and a range of low induction frequencies. I, difference in synaptic weight change between the ER+ and ER− spine, as a function of the NMDAR conductance and induction frequency. Lighter colours indicate enhanced LTD response in the presence of ICCR. [Colour figure can be viewed at wileyonlinelibrary.com]

