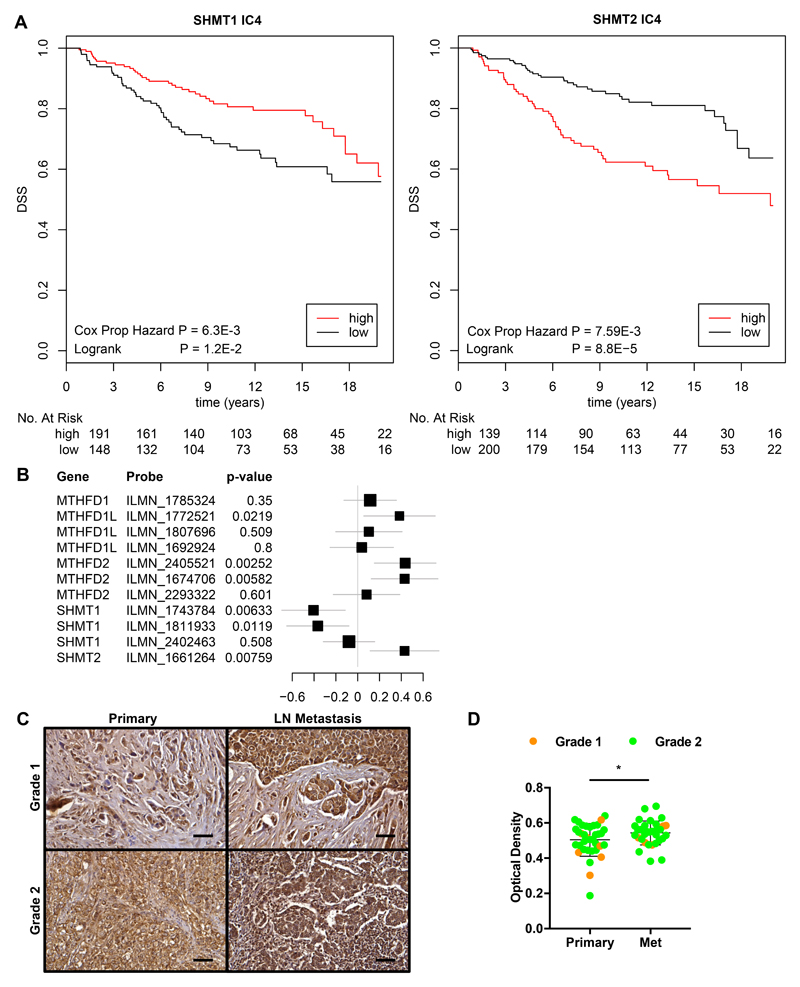
Figure 5. Mitochondrial serine and one-carbon unit pathway enzyme expression correlates with poor survival in human breast cancer.
(A) Kaplan-Meier plot for SHMT1 (left) and SHMT2 (right) expression associated with disease-specific survival (DSS) in the human IC4 patient subgroup (METABRIC). (B) Forest plot for the hazard of individual 1C unit pathway genes adjusted for covariates (age, grade, size, number of lymph nodes, ER, PR and Her2 status) in the IC4 subgroup (n=343). (C) Representative SHMT2 staining (at 40x) of human breast invasive ductal carcinoma and matched metastatic carcinoma tissue samples (LN = lymph node). (D) Quantification of SHMT2 intensity by IHC in metastatic lesions compared to primary tumors (mean ± SD, n = 33 per group, *P < 0.05 by two-tailed Student’s t test).

