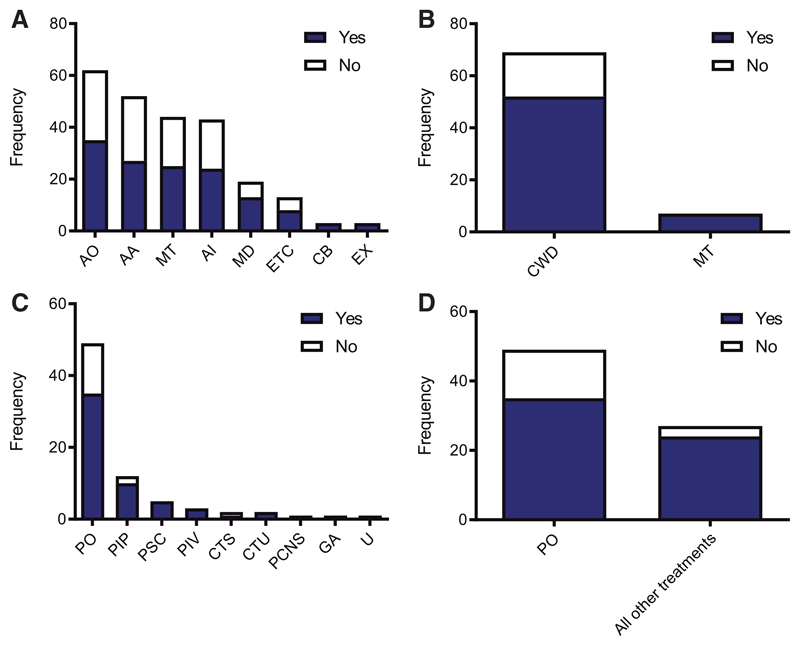
Figure 4. Subgroup analyses reveal no difference in efficacy between divergent pathways, putative target or mode of delivery of intervention.
(A) Frequency of studies implementing therapeutic interventions that target the following pathways: AO, anti-oxidative stress; AA, anti-apoptosis; MT, metabolism; AI, anti-inflammation; MD, mitophagy/degradation; ETC, electron transport chain; CB, calcium buffering; EX, excitotoxicity. Each column shows studies demonstrating efficacy in blue and no efficacy in white. Two-way ANOVA shows no statistically significant difference (P > 0.05). (B) Frequency of studies implementing interventions that specifically target mitochondria (MT) versus more generic cell-wide distribution (CWD). Each column shows studies demonstrating efficacy in blue and no efficacy in white. Chi2 demonstrates no statistically significant difference (P = 0.14). (C). Frequency of the mode of delivery of study interventions: PO, pharmaceutical oral; PIP, pharmaceutical intraperitoneal; PSC, pharmaceutical subcutaneous; PIV, pharmaceutical intravenous; CTS, cell transplant specific cell type indicated; CTU, cell transplant no specific cell type indicated; PCNS, pharmaceutical directly administered to central nervous system; GA, genetic intervention, all cells targeted; U, unknown/not stated. Each column shows studies demonstrating efficacy in blue and no efficacy in white. Two-way ANOVA shows no statistically significant difference (P > 0.05). (D) Post hoc analysis performed to compare pharmaceutical oral (PO) versus all other modes of delivery grouped together. Chi2 demonstrates no statistically significant difference (P = 0.08).

