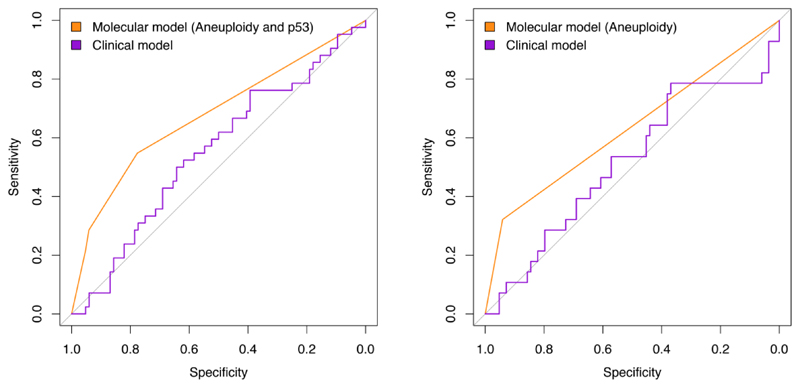
Figure 4. Receiver operating characteristic curves for a clinical model (age and Barrett’s length) vs molecular model.
Left panel) Analysis on all progressors: molecular model includes aneuploidy and p53 with a cutoff of at least one positive biomarker; Right panel) Analysis excluding progressors within 12 months of index endoscopy: molecular model includes only aneuploidy.

