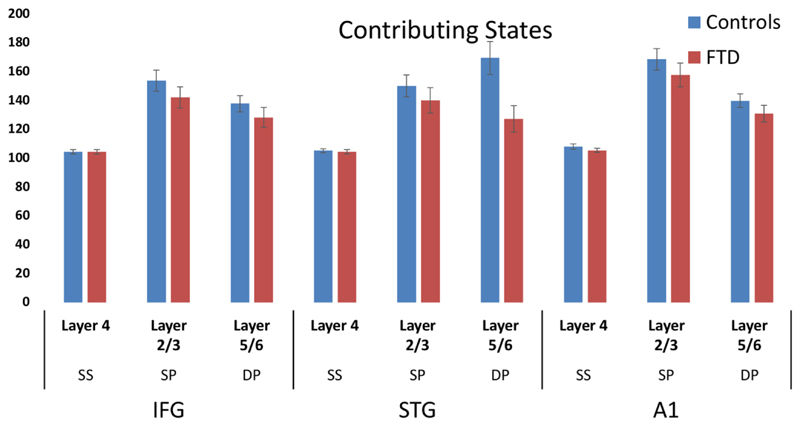
Figure 6.
Right: Bar chart with error bars demonstrating the layer contributions per node (with enforced symmetry). Blue and red bars depict controls and bvFTD groups, respectively. Left: Scatter demonstrating layer 5/6 STG reduction in bvFTD compared with controls (red) and the trend in layer 2/3 IFG (blue).

