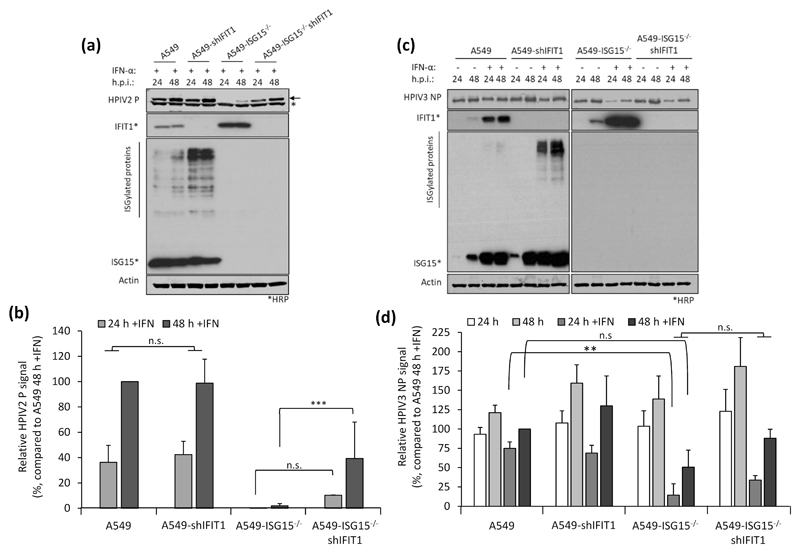
Fig. 5. Restoration of paramyxovirus infection in IFN-α-pretreated ISG15-/- cells reflects their reported sensitivity to IFIT1.
(a-b) Experiments were performed as in (Fig. 4a-b). (a) HPIV2 proteins were detected with antibodies specific for HPIV2 P (clone 161; (24)) and NIR-conjugated secondary antibodies. Asterisks denotes detection of an irrelevant protein, arrow denotes HPIV2 P. Samples not treated with IFN-α were omitted due to the highly lytic nature of HPIV2 which hampered their accurate quantification. (b) Quantification of normalised NP signals and compared to the 48 h p.i. sample that was set to 100%. (c) HPIV3 NP proteins were detected using antibodies specific for HPIV3 NP and NIR-conjugated secondary antibodies. (d) Normalised signals were quantified as in (b) and compared to IFN-α-treated, 48 h p.i. samples (set to 100%). Means and standard deviations were derived from 5 independent experiments for HPIV2 and 4 independent experiments (for HPIV3) performed on different occasions. Asterisks denote statistical significance using two-way ANOVA with Tuckey’s multiple comparison test (for HPIV3) and one-way ANOVA with Sidak’s multiple comparisons test (for HPIV2): ** (P < 0.01), *** (P < 0.001), n.s. denotes no statistical significance.

