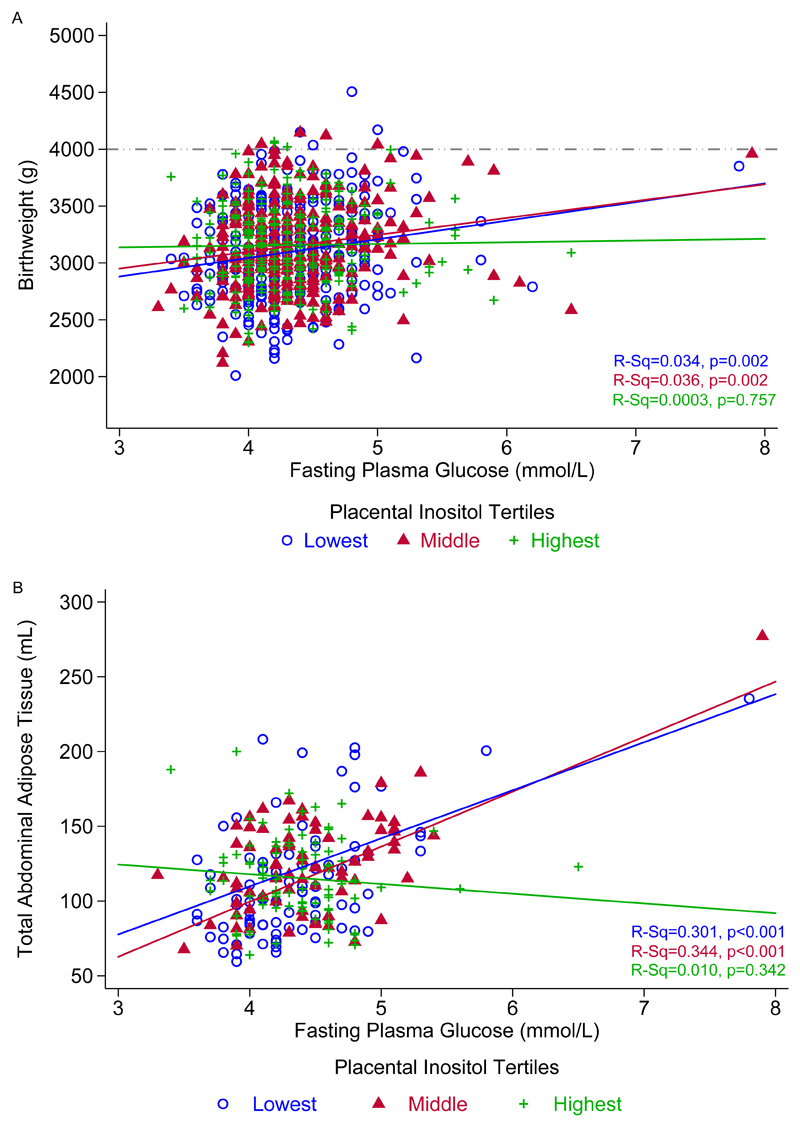
Figure 1.
Comparison of maternal mid-gestation fasting plasma glucose with: A) birthweight (n=884) and B) MRI-derived total abdominal adipose tissue (n=262), stratified by placental inositol tertiles. Pearson’s correlation (R-Sq) is presented, representing data with no adjustments for covariates. The dash-dot-dot line represents fetal macrosomia with a birthweight ≥4000 g.

