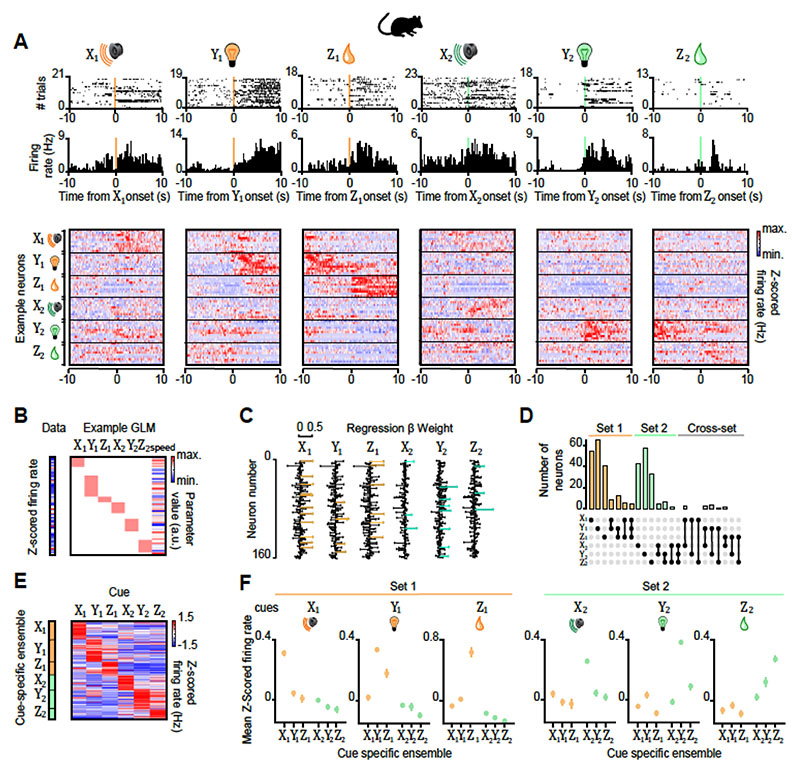
Figure 3. dCA1 neuronal representation of inference task cues.
In mice: (A) Upper and middle rows: Raster plots and peri-stimulus time histograms for 6 example neurons, each showing firing response to one of the 6 task cues (Xn, Yn and Zn) (Figure 1A). Lower row: Heatmap showing the average Z-scored firing rate (Hz) of 60 example neurons in response to task cues, according to the preferred cue on the y-axis. (B) For each recorded neuron, the average Z-scored firing rate across each trial was filtered by the “decision point” (Figure S4) and regressed onto a GLM that modelled all task cues and the mouse's average speed. GLM for an example neuron is shown. (C) For each cue, the regression weights from all neuron-specific GLMs are shown for an example recording day. Neurons with regression weights more than 2 standard deviations from the group mean were assigned to a cue-specific ensemble and color-coded for visualization (orange: set 1; green: set 2). (D) UpSet plot (Lex et al., 2014) showing the number of neurons within and shared across each cue-specific ensemble. Only a minority of neurons contributed to more than one cue-specific ensemble. (E-F) Average Z-scored firing rate of neurons in the Xn, Yn and Zn ensembles in response to each task cue (F, mean±SEM).

