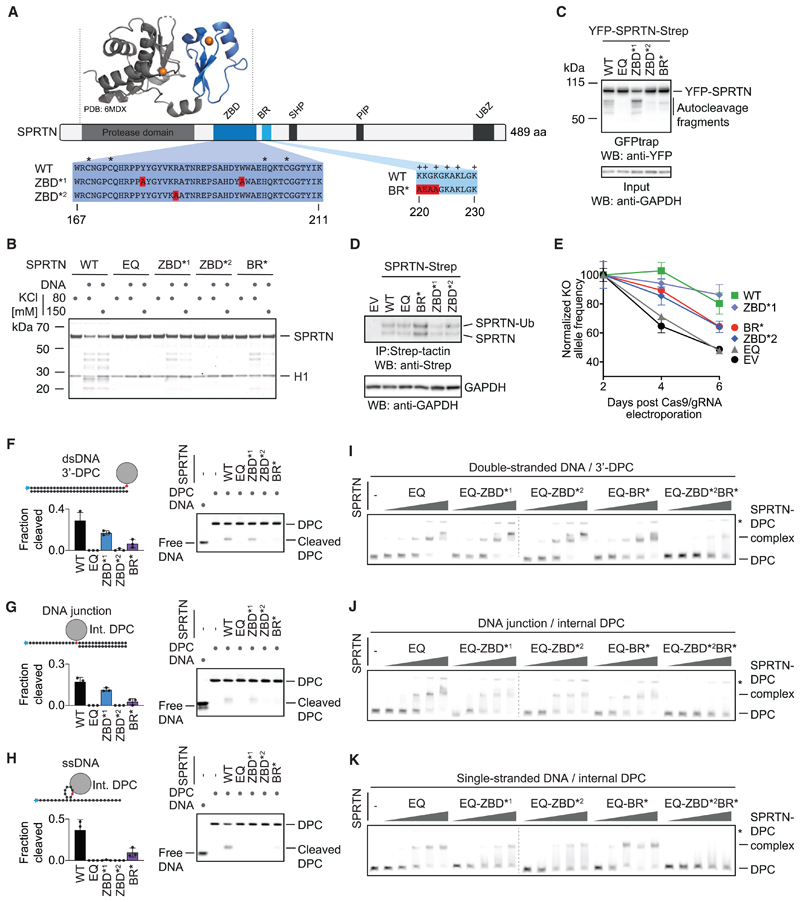
Figure 3. SPRTN’s Structure-Specific Activity Requires Two Distinct DNA-Binding Domains.
(A) Schematic of SPRTN’s domain structure, highlighting the zinc-binding domain (ZBD), the basic DNA-binding region (BR), the SHP box (p97 binding), the PCNA-interacting motif (PIP), and the ubiquitin-binding zinc finger (UBZ). Asterisks indicate the zinc-coordinating residues within the ZBD, and plus signs indicate positively charged amino acids within the BR. The function of the ZBD and BR were tested in this study using the indicated amino acid replacements (ZBD*1, Y179A/W197A; ZBD*2, R185A; BR*, K220A/K221E/G222A/K223A).
(B) Recombinant SPRTN (500 nM, WT or the indicated variants) and histone H1 (500 nM) were incubated alone or in the presence of ssDNA circles (ΦX174 virion) for 2 h at 25° C in the presence of 80 or 150 mM KCl. Reactions were analyzed by SDS-PAGE followed by Coomassie staining.
(C) SPRTN autocleavage assessed in cells. The indicated YFP-SPRTN-Strep variants were transiently transfected in HeLa Flp-In TRex cells. SPRTN auto-cleavage fragments were enriched on GFP trap resins, followed by western blotting against the N-terminal YFP tag. Western blotting against GAPDH of cell lysates served as loading control.
(D) HAP1 cell lines complemented by retroviral transduction with cDNAs encoding the indicated C-terminally Strep-tagged SPRTN variants. SPRTN-Strep was enriched on Strep-tactin beads prior to western blotting because of low expression levels. Western blotting against GAPDH of cell lysates served as loading control.
(E) The indicated cell lines were transfected with NLS-Cas9/gRNA complexes targeting the UTRs of the endogenous SPRTN allele. The ratio between the resulting knockout (KO) allele compared with the WT allele was monitored over time using qPCR. A schematic of the genotyping strategy is depicted in Figure S3C. Values represent the mean ± SD of three technical replicates normalized to day 2.
(F–H) The indicated fluorescently labeled model DPCs (25 nM) were incubated alone or in the presence of recombinant SPRTN (WT or the indicated variants) for 2 h at 25° C prior to separation by native PAGE. SPRTN concentrations were 5 nM in (F) and (H) and 12.5 nM in (G). Quantification: values represent the mean ± SD of three independent experiments.
(I–K) EMSAs were used to assess binding of catalytically inactive SPRTN EQ (alone or in combination with the indicated amino acid replacements in the ZBD/BR) to the indicated DPCs (25 nM). SPRTN concentrations were 3.125, 6.25, 12.5, 25, and 50 nM. Asterisks indicate non-resolvable high-molecular-weight aggregates.
See also Figure S3.

