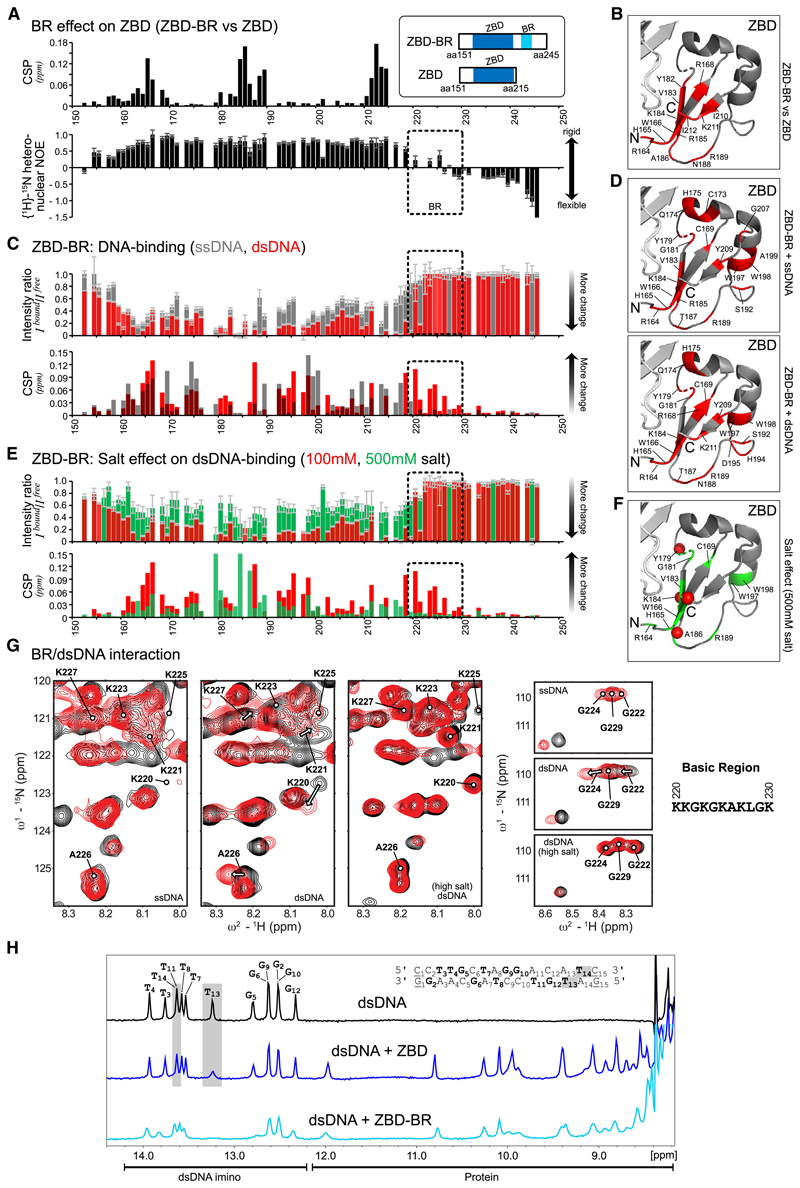
Figure 4. NMR Analysis Reveals Bipartite Recognition of DNA Structures by SPRTN.
(A) Comparison of NMR data for two SPRTN constructs comprising the ZBD only or ZBD and the BR (ZBD-BR). Top: chemical shift differences of the backbone amide resonances between ZBD and ZBD-BR. Bottom: backbone flexibility of ZBD-BR from {1H}-15N-heteronuclear NOE data. Errors for heteronuclear NOE values were estimated from error propagation of peak height uncertainties based on average noise levels (six randomly chosen positions in each NMR spectra). The dotted area indicates the BR region.
(B) Mapping of chemical shift differences of ZBD in the presence of BR from (A) onto the ZBD structure (PDB: 6MDW). Red color highlights residues with CSPs of more than 0.025 ppm in (A).
(C) Chemical shift perturbations (CSPs) and intensity differences (line broadening) of backbone amides in ZBD-BR upon addition of an equimolar ratio of ssDNA (gray) and dsDNA (red). Errors for intensity ratios upon DNA-binding were estimated from error propagation of peak height uncertainties based on average noise levels (six randomly chosen positions in each NMR spectra). The dotted area indicates the BR region. No boxes are shown for prolines, unassigned, or ambiguous (overlapped) residues. Spectral overlays are show in Figure S4B.
(D) Spectral changes upon DNA binding are mapped onto the ZBD structure (PDB: 6MDW). Changes observed for binding of ZBD-BR to ssDNA (top) or dsDNA (bottom) are shown in red for residues with an intensity ratio of less than 0.15 (85% intensity loss) or CSPs of more than 0.05 ppm.
(E) CSP and intensity changes of ZBD-BR upon addition of an equimolar dsDNA at 100 mM (low salt, red) and 500 mM (high salt, green) salt concentrations. Errors as in (C). Spectral overlays are shown in Figure S4B.
(F) Spectral changes upon dsDNA binding at high salt concentration are mapped onto the ZBD structure (PDB: 6MDW), where the 10 residues with the highest intensity or CSP changes are shown in green. Red spheres indicate changes with an intensity ratio of less than 0.15 (85% intensity loss) or CSPs of more than 0.05 ppm (as in D).
(G) NMR signals (black, free; red, bound) in Figure S4A, highlighting BR residues upon addition of an equimolar ssDNA, dsDNA at 100 mM salt concentration, and dsDNA at 500 mM salt concentration. See Figure S4B for the experimental conditions.
(H) Top: 1H-NMR spectrum of the 15-mer dsDNA. Assignments of the imino resonances of T and G in base pairs in the dsDNA ligand are shown in bold in the sequence. Only 13 signals are observed because of fraying of the terminal base pairs (underlined in the sequence). Center and bottom: 1H-NMR imino spectra of the dsDNA in the presence of an equimolar amount of ZBD or ZBD-BR, respectively. The gray box indicates strongly affected signals (line-broadening) upon addition of the ZBD. NMR spectra were recorded with 100-mM sample concentration in 100 mM potassium chloride, 50 mM HEPES (pH 7.5), 2 mM TCEP at 298 K on a 600-MHz spectrometer.
See also Figure S4.

