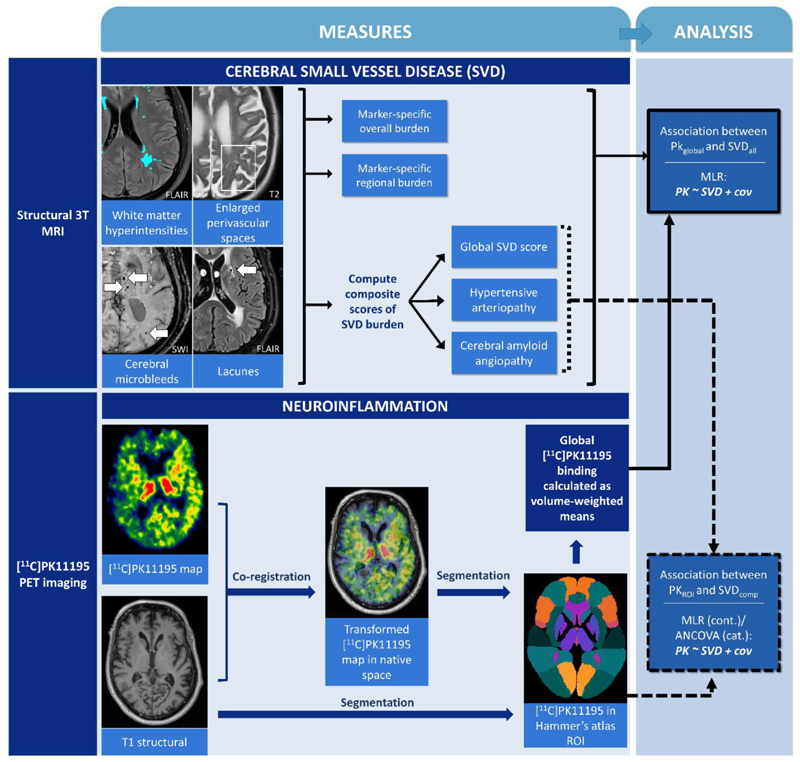
Figure 1. Schematic representation of multimodal imaging data, image processing pipeline, quantification of pathological burden, and statistical approach to test associations between pathologies.
Abbreviations: MLR = multiple linear regression; cont. = continuous SVD measures; cat. = categorical measures, e.g., presence/absence of microbleeds and lacunes; PKglobal = global [11C]PK11195 binding; PKROI = [11C]PK11195 binding in each Hammer’s atlas region of interest; SVDall = each measure of SVD, including global and regional data of each SVD marker, and composite SVD scores; SVDcomp = composite SVD scores; cov = covariates (sex, age, education, ACE-R, scan interval).

