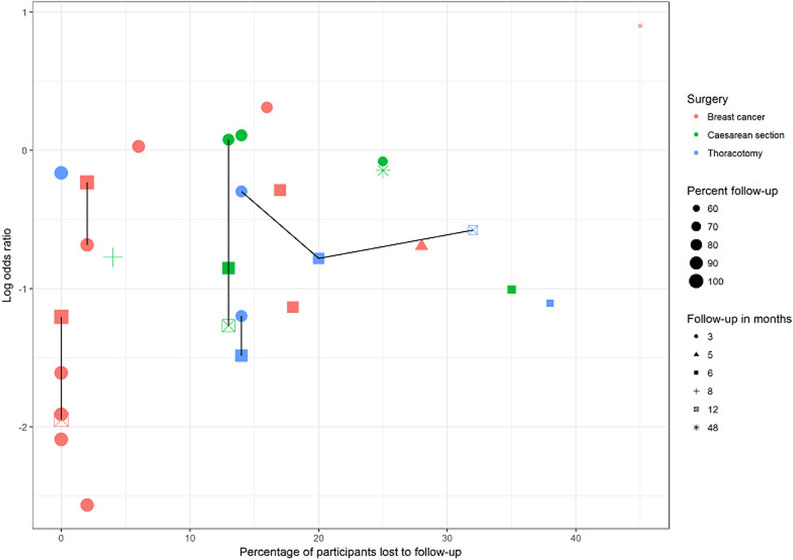
Figure 4.

This graph plots attrition versus effect size (log odds ratio) for studies investigating regional anaesthesia for the prevention of persistent pain after thoracotomy (blue), breast surgery (pink) and caesarean section (green). Symbol size decreases with attrition. Repeated follow-ups within one study are linked with a black line. We are unable to discern any association between attrition, follow-up time and effect measure; this lends support to our decision to pool studies reporting outcomes at different follow-up intervals and with different attrition.
