Figure 2.
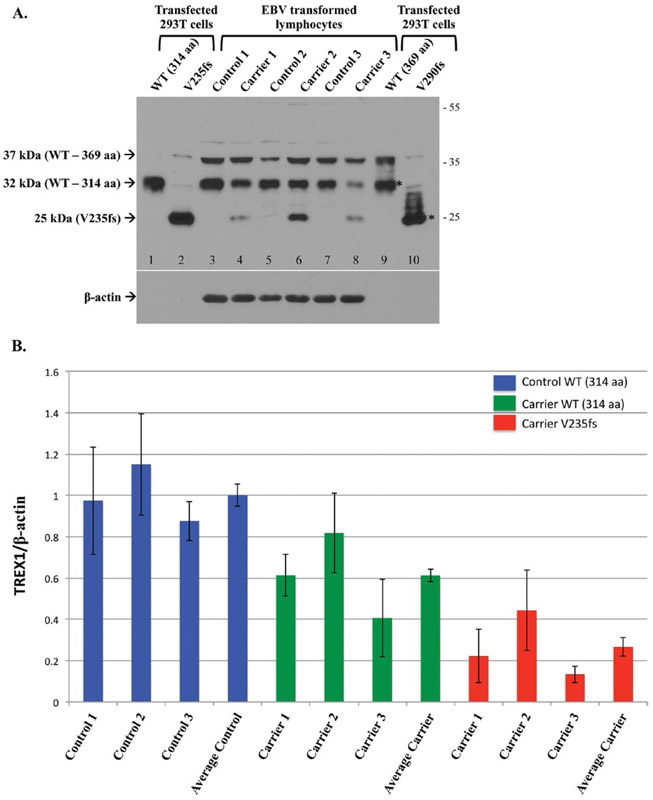
Endogenous expression of TREX1 in normal controls and heterozygous carriers of the V235fs mutant. A. Representative Western blot of transfected TREX1 in 293T cells (lanes 1–2, 9–10) and untransfected EBV transformed lymphocytes from normal controls and RVCL mutation carriers. The transfected protein is detected for both isoforms of wild-type (WT, lanes 1 and 9) and the frame-shift mutant of isoform-B (V235fs, lane 2). The frame-shift mutant of isoform-A (V290fs, lane 10) is not well seen. Both the wild-type and frame-shift mutant of isoform-A also produce the smaller isoform-B (*). Endogenous WT TREX1 is detected in all EBV transformed lymphocytes. The 37 kDa band represents TREX1 isoform-A (lanes 3–8). The V235fs mutant is detected in cell lines derived from heterozygous carriers of the mutation (lanes 4, 6, and 8) but not in normal controls (lanes 3, 5, and 7). Endogenous expression of the V290fs mutant is not detected. Membrane was stripped and reprobed with anti-β-actin as a loading control. B. The expression of TREX1 protein was normalized to a β-actin loading control. For each group, Control WT, Carrier WT and Carrier V235fs, data are shown for the 3 individuals analyzed followed by the average for that group. TREX1 levels are given relative to the average of WT in the 3 normal controls (Average Control), which was arbitrarily set to 1.0. Data are presented as mean ± SD and represent 8 independent samples.

