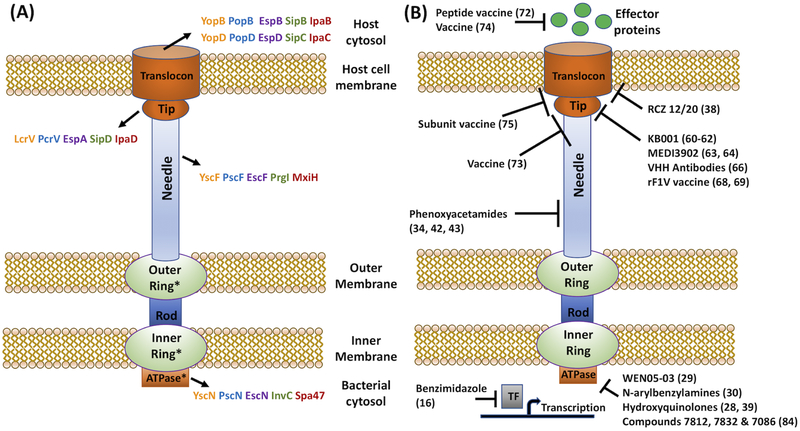
Figure 1.
(A) Structure of T3SSi. * indicate regions with conserved components between T3SSi and flagella. Yersinia = orange; Pseudomonas = blue; EPEC/EHEC = purple; Salmonella = green; Shigella = red. (B) Potential targets of compounds based on inhibition of T3SSi function, biochemical or binding studies, genetic resistance, or animal studies.

