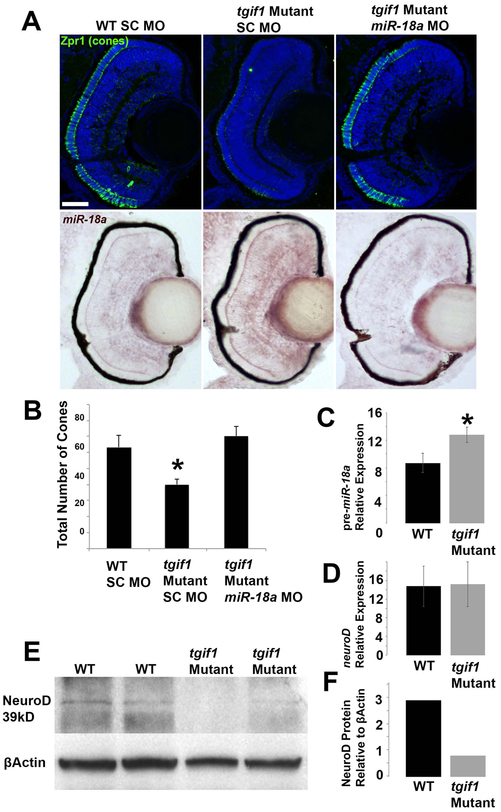
Figure 6. tgif1 mutant larvae fewer photoreceptors, increased miR-18a expression and reduced NeuroD protein levels.
(A) Immunolabeling for cone photoreceptors (Zpr-1) at 70 hpf in WT larvae injected with standard control morpholinos (SC MO), tgif1 mutant larvae injected with SC MO, tgif1 mutant larvae injected with miR-18a morpholinos, with corresponding images showing in-situ hybridization for miR-18a in the same retinas; scale bar = 50 μm. (B) Cone photoreceptor counts in retinal cross-sections (n=3 larvae each) in fish corresponding to the images in (A). (C) Standard qPCR showing pre-miR-18a expression in 70 hpf WT larvae compared with tgif1 mutants (n=40 heads); normalized to βactin and shown relative to let-7b expression. (D) Standard qPCR comparing neuroD mRNA expression in 70 hpf larvae between WT and tgif1 mutants (n=40 heads); normalized to βactin and shown relative to ccnb1 expression. (E) Western blot showing NeuroD protein levels in 70 hpf WT compared with tgif1 mutant fish (n=40 heads). (F) Quantification of the average band intensities in E. All error bars represent standard deviation and comparisons were made with Student’s t-tests (asterisks indicate p<0.05).

