
Figure 1. Transmission Electron Microscope and western blot images and Nanosight images.
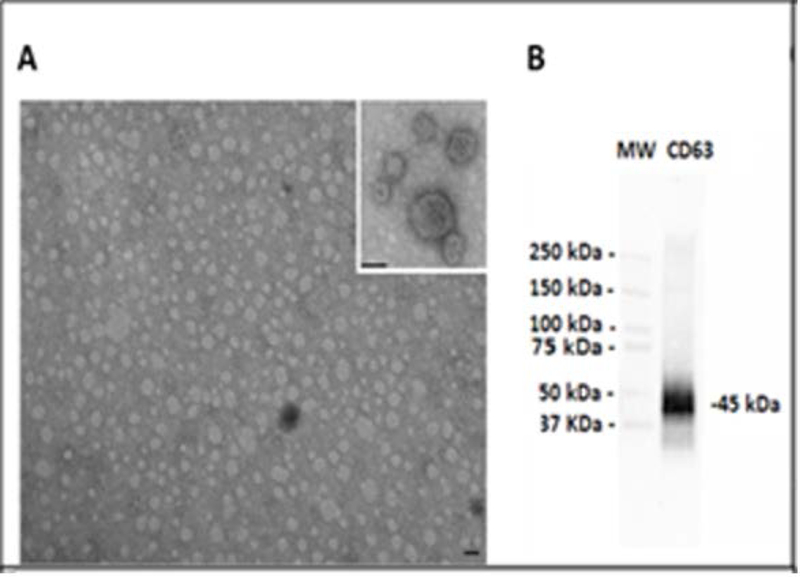
(A) Representative transmission electron microscopy of EVs isolated from saliva. EVs were viewed by JEOL Jem 1010 electron microscope (original magnification X100,000; inset original magnification X150,000; black lines= 100 nm). (B) Representative Western Blot analysis of CD63 from saliva EVs. (MW= standard molecular weight markers).