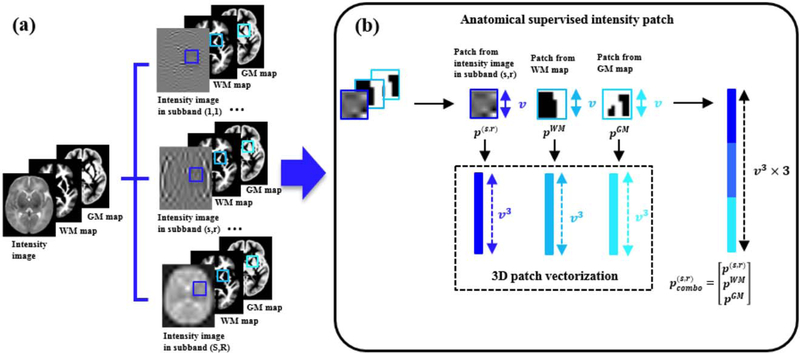
Figure 3.
(a) Atlas construction in each frequency subband is guided by WM and GM tissue maps; (b) Local cubic patch from subband intensity image, WM map and GM map are vectorized and combined into a single vector. Thus the atlas construction processes in the respective frequency subbands are restricted by common tissue features. [Color figure can be viewed in the online issue, which is available at wileyonlinelibrary.com.]

