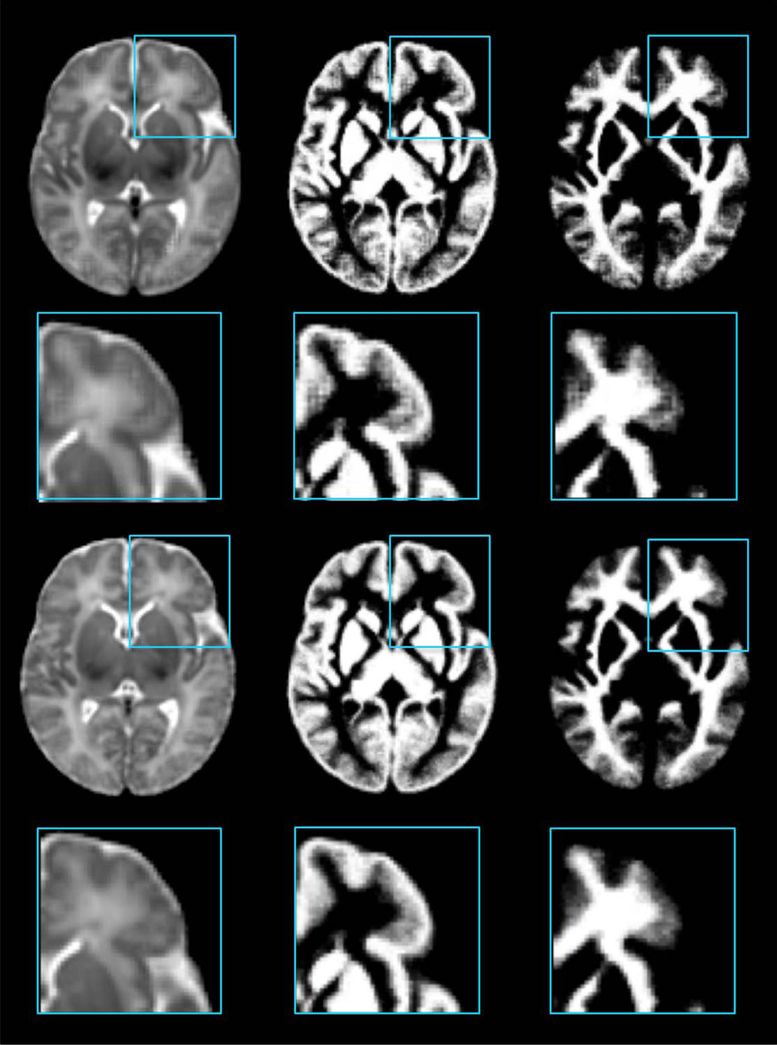
Figure 8.
Atlas construction without/with frequency domain construction. The top two rows show the intensity atlas and the probability tissue maps constructed from the original image domain. The bottom two rows show the atlases given by the proposed method. [Color figure can be viewed in the online issue, which is available at wileyonlinelibrary.com.]

