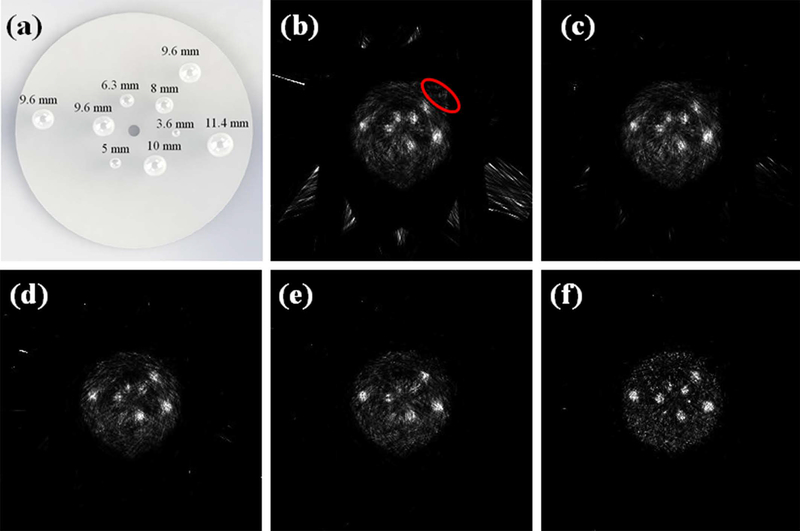
Figure 8.
Images of the cylindrical phantom measured by the simulated POC-PET systems. (a) The distribution of nine spherical tumors in the phantom simulated in the Monte Carlo study Images were reconstructed (b) without the TOF information or with a detector CRT of (c) 700 ps FWHM; (d) 500 ps FWHM; (e) 300 ps FWHM; and (f) 100 ps FWHM.

