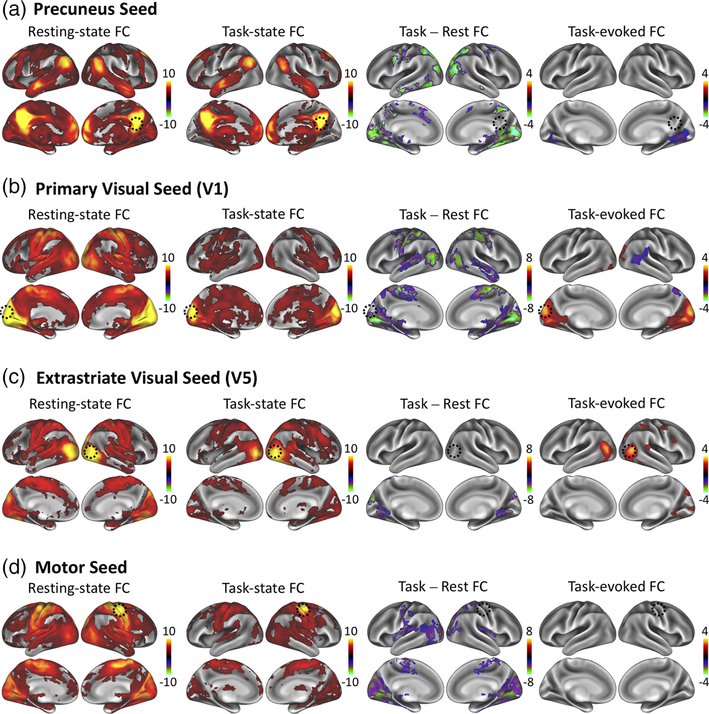
FIGURE 1.
Seed-based functional connectivity findings. Seed-based functional connectivity using a seed in (a) PCu, (b) V1, (c) V5, and (d) M1. Each panel shows the result for within-session FC during eyes-closed resting-state (left), within-session FC during the movie task (left middle), the within-session FC difference during the movie relative to rest (right middle), and the task-evoked FC computed using inter-subject correlations (right). Cluster-level significance thresholds were set at a p < 0.05 corrected for multiple comparisons. The color bar indicates z-values [Color figure can be viewed at wileyonlinelibrary.com]

