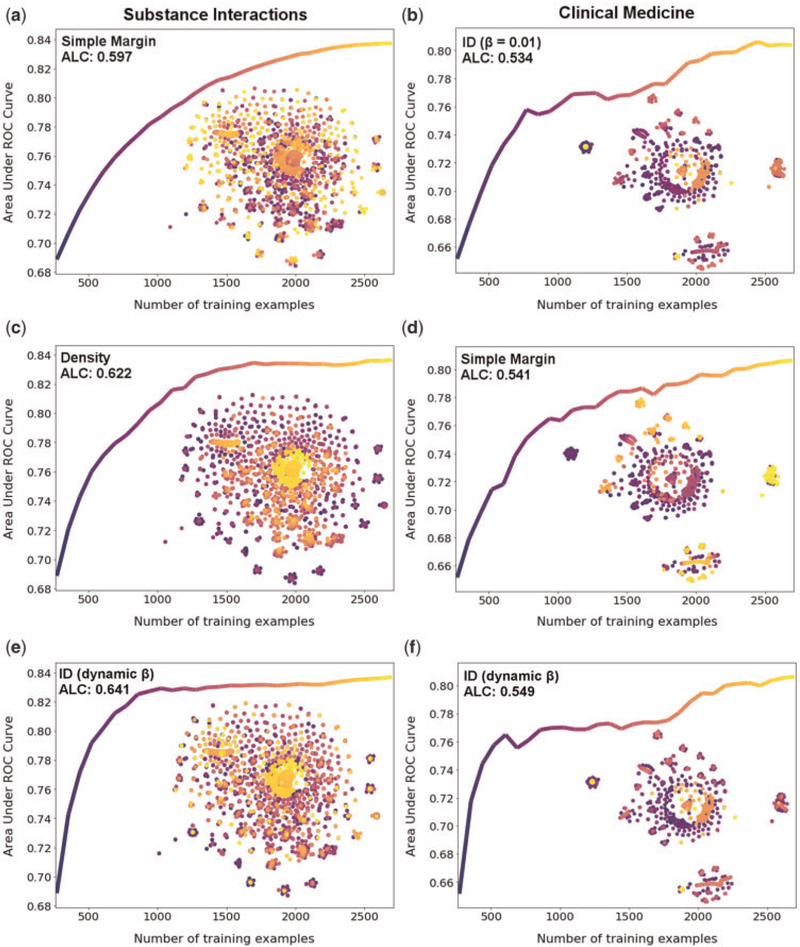
Figure 4.
Query patterns of the low, middle, and high performing query strategies for the substance interactions and clinical medicine datasets overlaid on a visualization of U generated using t-SNE along with their corresponding learning curves. Dark blue corresponds to the first examples queried. Yellow corresponds to the last examples queried. Columns correspond to the substance interactions and clinical medicine datasets, respectively. Rows from the top correspond to the low, middle, and high performing query strategies, respectively.

