Figure 2.
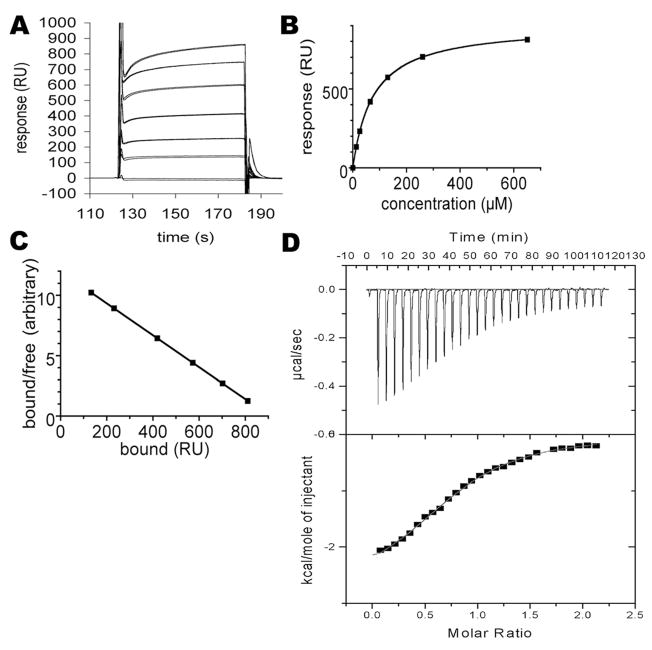
Analysis of CRMP-2 and CaM interaction by surface plasmon resonance (SPR) and isothermal titration calorimetry (ITC). (A) The sensorgrams for injecting various concentrations of CaM over the immobilized recombinant human CRMP-2 (residues 1–490). Duplicate samples are shown. The concentrations are (from highest to lowest response, respectively): 650, 260, 130, 65, 26, 13, and 0 μM. (B) Plotting of the responses against CaM concentration. Duplicate samples are shown, but the values for duplicates are essentially identical. (C) Scatchard plot of the binding data. The points fit perfectly on a straight line, indicating a single binding event. (D) Calorimetric analysis of the binding of CaM to the putative binding site on CRMP-2. Top: The peptide (residues 479–496) was injected into a solution of CaM. Bottom: After integrating the peak area for each injection, the binding isotherm was used to obtain thermodynamic parameters for the interaction.

