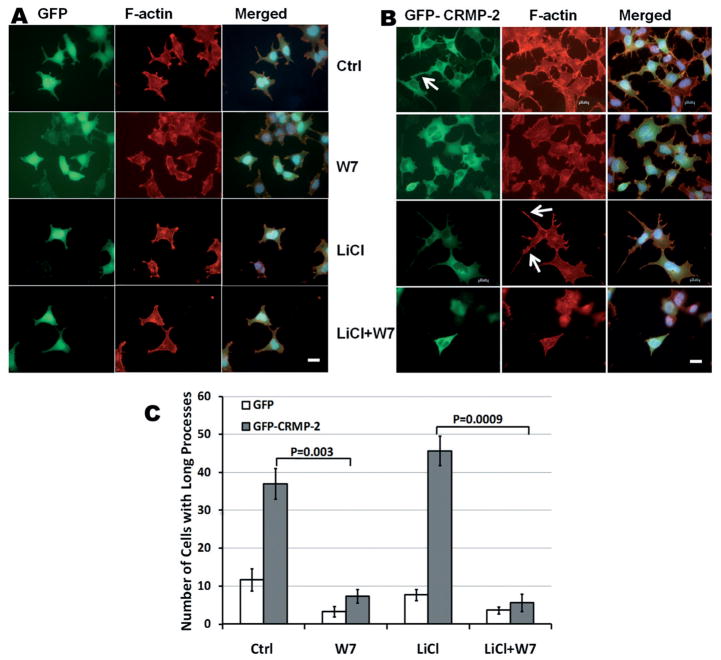
Figure 6.
CaM antagonist induces process retraction in CRMP-2-overexpressing HEK293 cells. HEK293 cells with overex-pressed GFP (A) or GFP-CRMP-2 (B) were treated with CaM antagonist W7 (10 μM), LiCl (5 mM) or both. GFP fluorescence was imaged (green), and F-actin was stained by rhodamine-phalloidin (red). Yellow color in merged photographs corresponds to the colocalization of CRMP-2 and F-actin. Arrows indicate the CRMP-2-induced F-actin-enriched processes. Scale bar = 20 μM. (C) Quantification of cells with at least one process greater than half the diameter of the cell body following various treatments. For each experiment, 50 cells per slide were randomly measured. The values shown are the mean of three independent experiments. Error bars represent SEM. Significant differences between the different treatments between two groups were analyzed by Student’s t-test.

