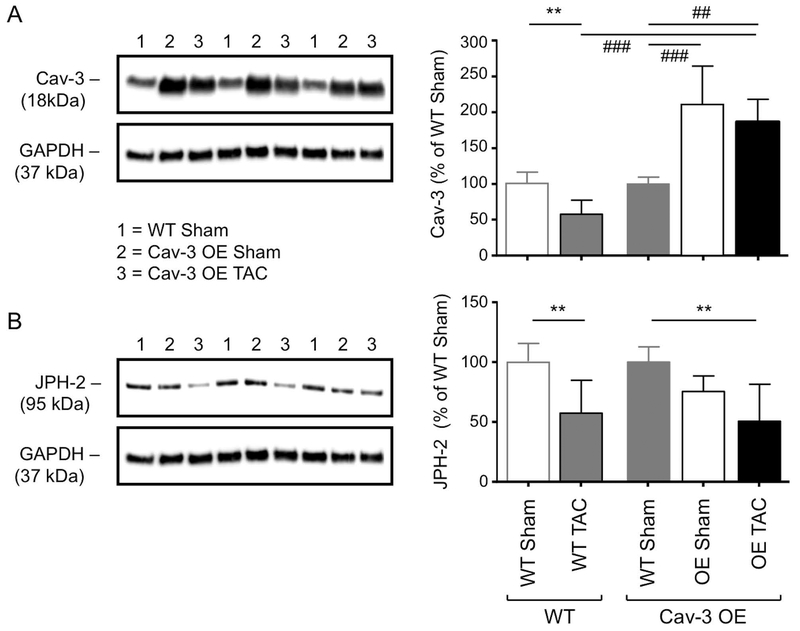
Figure 3. Effect of Cav-3 OE and TAC on Cav-3 and JPH-2 protein expression.
(A) Left panel: Exemplar western blots of Cav-3 (18 kDa) and GAPDH (37 kDa) in isolated myocyte lysates from three WT sham (lanes “1”), three Cav-3 OE sham (lanes “2”) and three Cav-3 OE TAC (lanes “3”) mice; Right panel: densitometry analysis of Cav-3 western blots (N=5 animals in each group in duplicate), compared with previously published data (Bryant et al., 2018a) showing the effect of TAC on Cav-3 expression in WT mice (left 2 bars). (B) Left panel: Exemplar western blots of JPH-2 (95 kDa) and GAPDH (37 kDa); Right panel: densitometry analysis of JPH-2 western blots (N=5 animals in each group in duplicate), compared with previously published data (Bryant et al., 2018a) showing the effect of TAC on JPH-2 expression in WT mice (left 2 bars). The blots in the left panels are from the same gels which were stripped and re-probed for the different proteins and were therefore obtained sequentially (see Methods). Data in each group (WT or Cav-3 OE) in the right panels are expressed as a percentage of the mean of the WT data in that group. ** p<0.01, *** p<0.001 between treatments for a given phenotype (WT or Cav-3 OE); ## p<0.01, ### P<0.001 between phenotypes for a given treatment (sham or TAC).

