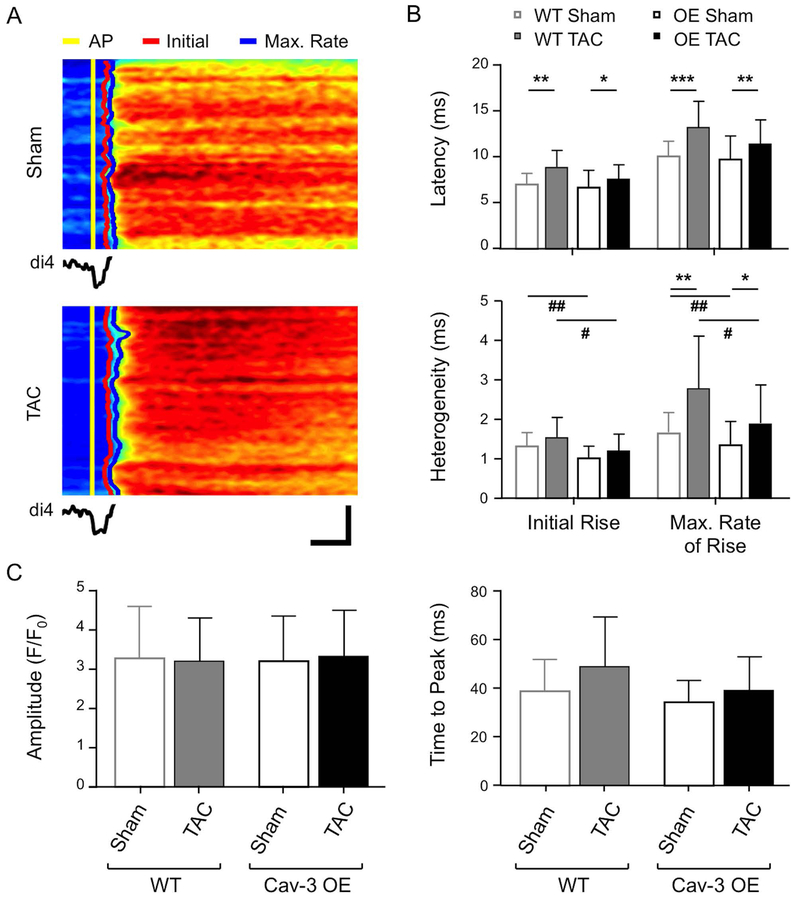
Figure 5. Local Ca release and systolic Ca transient.
(A) Line-scan images of the rising phase of the Ca transient and (below) the associated average t-tubular di-4-AN(F)EPPTEA signal in representative sham (top) and TAC (bottom) Cav-3 OE myocytes. Horizontal scale bar: 10 ms; vertical scale bar: 5 μm. The time of the AP upstroke, initial rise of Ca and maximum rate of rise of Ca have been marked in yellow, red and blue, respectively. (B) Mean latency and heterogeneity of SR Ca release in sham (n/N = 28/5) and TAC (n/N =18/4) Cav-3 OE myocytes compared with WT sham (n/N=43/12) and TAC (n/N=12/3) myocytes. (C) Whole cell Ca transient amplitude (F/F0) and time to peak (ms) measured from Ca transients of sham (n/N = 25/5) and TAC (n/N = 22/4) Cav-3 OE myocytes compared with WT sham (n/N=53/13) and TAC (n/N=14/3) myocytes. * p<0.05, ** p<0.01, *** p<0.001 between treatments for a given phenotype (WT or Cav-3 OE); # p<0.05, ## p<0.01 between phenotypes for a given treatment (sham or TAC). The WT data have been published previously (Bryant et al., 2018a)

