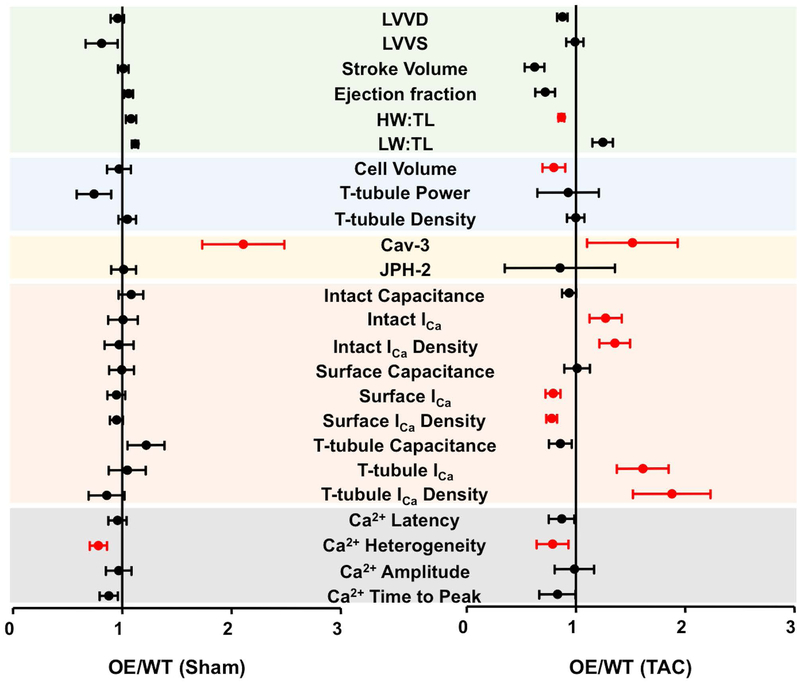
Figure 6. Comparison of WT and OE data.
Plots showing the ratio of data from Cav-3 OE mice/those in WT mice, ± 95% confidence intervals, in sham (left) and in HF following TAC (right). The WT data have been published previously (Bryant et al., 2018a). The x axis shows the change relative to WT: an increase in Cav-3 OE mice compared to WT results in a value >1, while a decrease results in a value <1. The coloured bands delineate different groups of data that correspond to those shown in Figs. 1 (green, top) to 5 (grey, bottom). The data in red are significantly different in Cav-3 OE and WT mice (statistical analysis performed using original data).
LVVD, left ventricular volume at diastole, μl; LVVS, left ventricular volume at systole, μl; Stroke Volume ml.min-1; Ejection Fraction, %; HW:TL, heart weight to tibial length ratio, mg/mm; LW:TL, lung weight to tibial length ratio, mg/mm; Volume, pL; Cell Capacitance, pF; T-tubule Power, P1/P0; T-tubule Density, μm/μm3; Cav-3, caveolin-3 expression, %; JPH-2, junctophilin expression, %; Intact Capacitance, whole-cell capacitance, pF; Intact ICa, whole-cell ICa amplitude at 0 mV, pA; Intact ICa Density, whole-cell ICa density at 0 mV, pA/pF; Surface Capacitance, surface membrane capacitance, pF; Surface ICa, surface membrane ICa amplitude at 0 mV, pA; Surface ICa Density, surface membrane ICa density at 0 mV, pA/pF; T-tubule Capacitance, t tubule membrane capacitance, pF; T-tubule ICa, t-tubule membrane ICa amplitude at 0 mV, pA; T-tubule ICa Density, t-tubule membrane ICa density, pA/pF; Ca2+ Latency, calcium transient latency from action potential depolarisation, ms; Ca2+ Heterogeneity, calcium transient heterogeneity during upstroke, ms; Ca2+ amplitude, Calcium transient amplitude; Ca2+ Time To Peak, ms.

