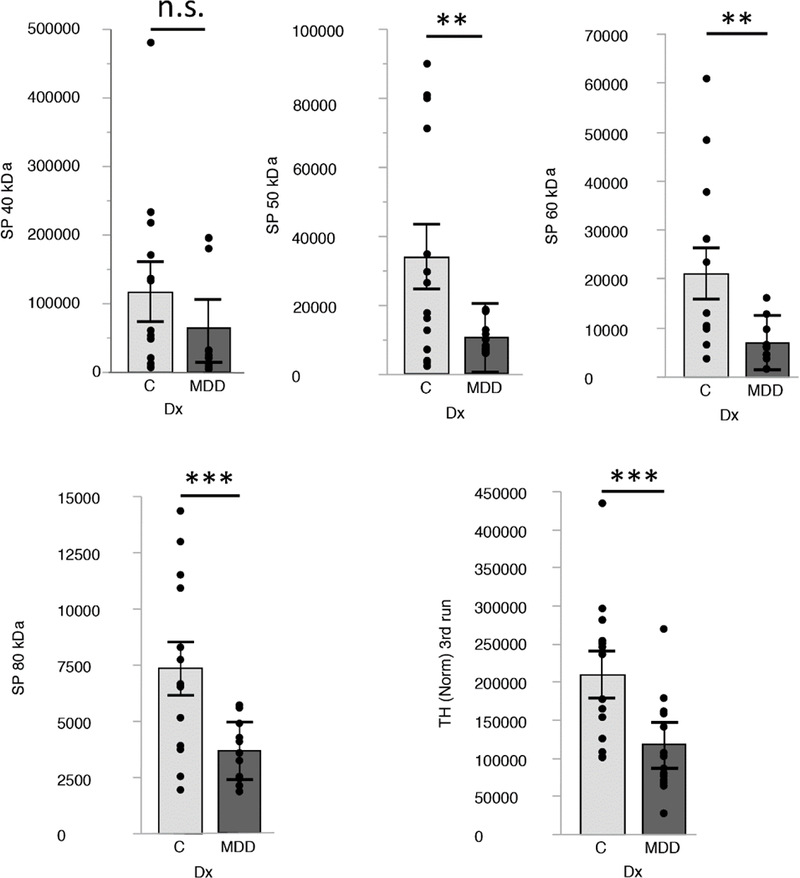
Figure 4: DAT and TH expression in post-mortem analyses.

DAT and TH expression levels are decreased in the putamen of people with MDD. Box blots show expression levels (mean and SE) for DAT (40, 50, 60/65 and 80 kDa) and TH (60 kDa). Highly significant changes (p= 0.01 to 0.001) are marked with ** and significant changes to (0.05 to 0.01) are marked with *. Not significant (≥ 0.05; ns). Protein levels are expressed as normalized signal in fluorescence arbitrary units (A.U.; LI-COR Odyssey CLx scanner).
