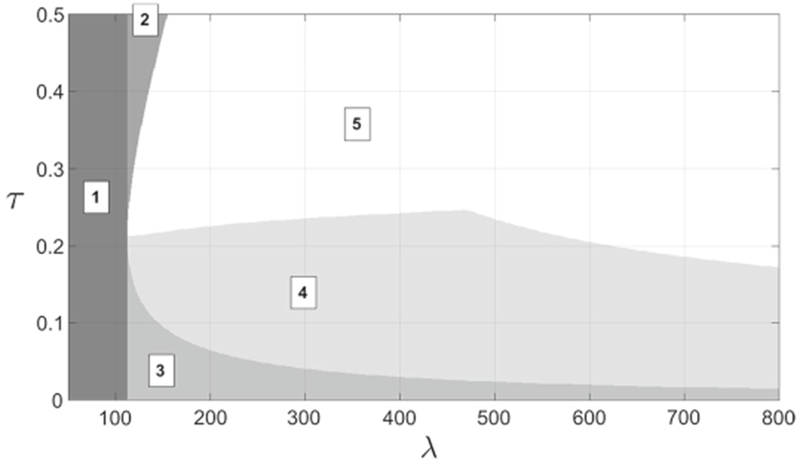
Fig. 4.

Two-parameter bifurcation diagram obtained for the monomer source rate λ and the polymerization rate τ, when the other parameters are described in Table 1 (Strain 1). The vertical line delimits the apparition of the subunit only equilibria, left of that line (Region 1) only the disease-free equilibrium exists and it is then globally stable (not proved). The branches delimit the existence of the endemic equilibrium. In Region 2, the subunit only equilibria exist but neither is stable. In Region 3, the subunit only equilibria exist and the higher one (S+) is locally stable. In-between the branches, the endemic steady-state exists, but it is only locally stable in Region 4. In Region 5, the endemic steady-state is unstable. The boundary between Regions 4 and 5 corresponds to a Hopf bifurcation
