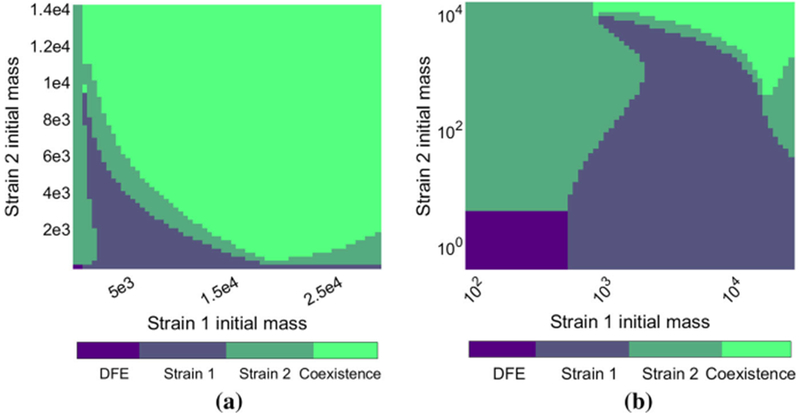
Fig. 8.

Representation of the basins of attraction of the different equilibria in the two-strain case, in linear scale (a) and logarithmic scale (b). The parameters used are described in Table 1. Each strain is initialized with its steady state proportions (see Sect. 2.1) and diluted with a specific rate (between 1 and 1.10−5), and V is initialized to the disease-free value λ/γ. The axes represent the initial mass of each strain, i.e. the initial value of P + S for each strain (Strain 1 on the horizontal axis, Strain 2 on the vertical axis). The colors represent the outcome of the simulation (with colorbar above), one strain only or the two strains stably coexisting. Notice that the disease-free equilibrium is observed only in the bottom left corner (a) Linear scale (b) Logarithmic scale
